Fig. 9.
Download original image
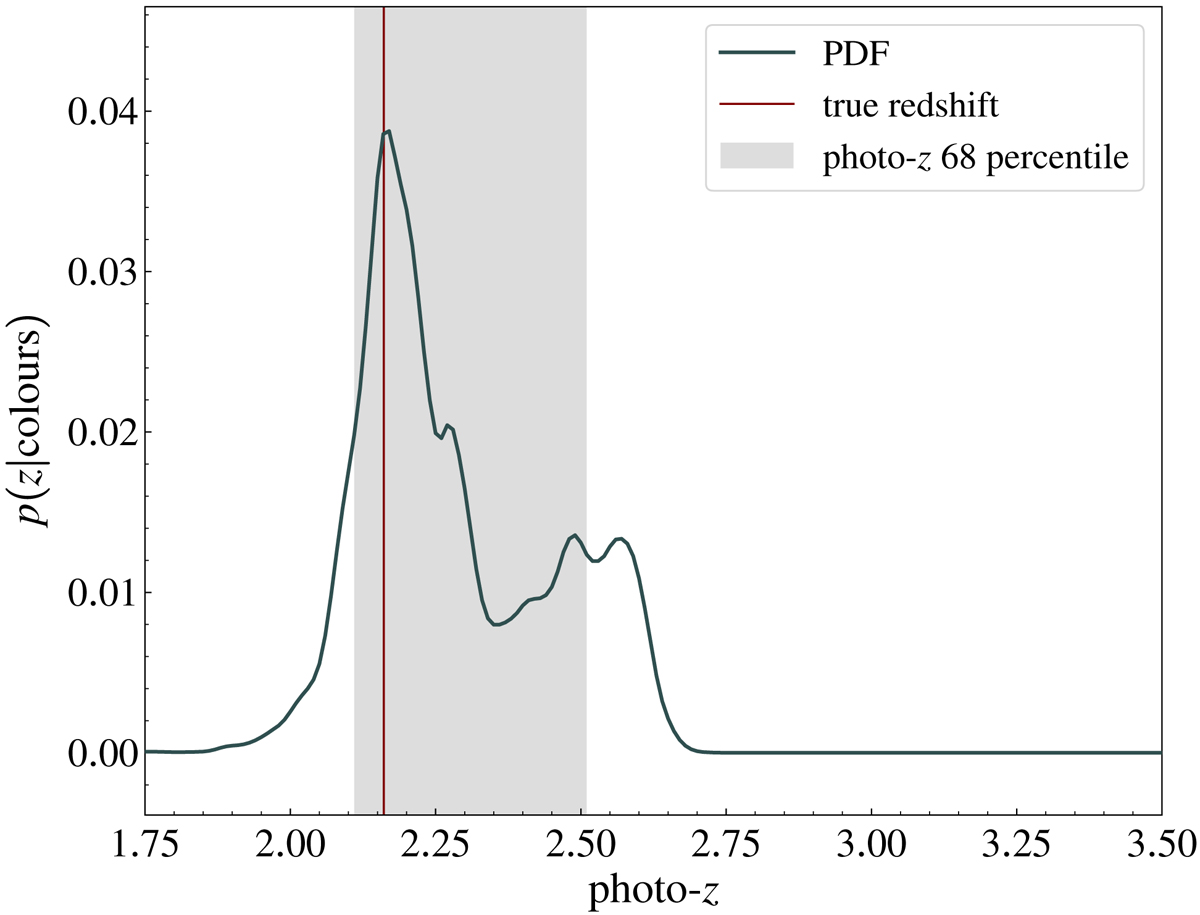
Example of a normalised photo-z probability distribution function (PDF), obtained by running a photo-z algorithm (BPZ is used here) on the best-fit source colours and their uncertainties. The red line shows the true redshift, and the grey region shows the 68th percentile of the redshift PDF. The redshift with the highest probability is used as the estimated photo-z.
Current usage metrics show cumulative count of Article Views (full-text article views including HTML views, PDF and ePub downloads, according to the available data) and Abstracts Views on Vision4Press platform.
Data correspond to usage on the plateform after 2015. The current usage metrics is available 48-96 hours after online publication and is updated daily on week days.
Initial download of the metrics may take a while.