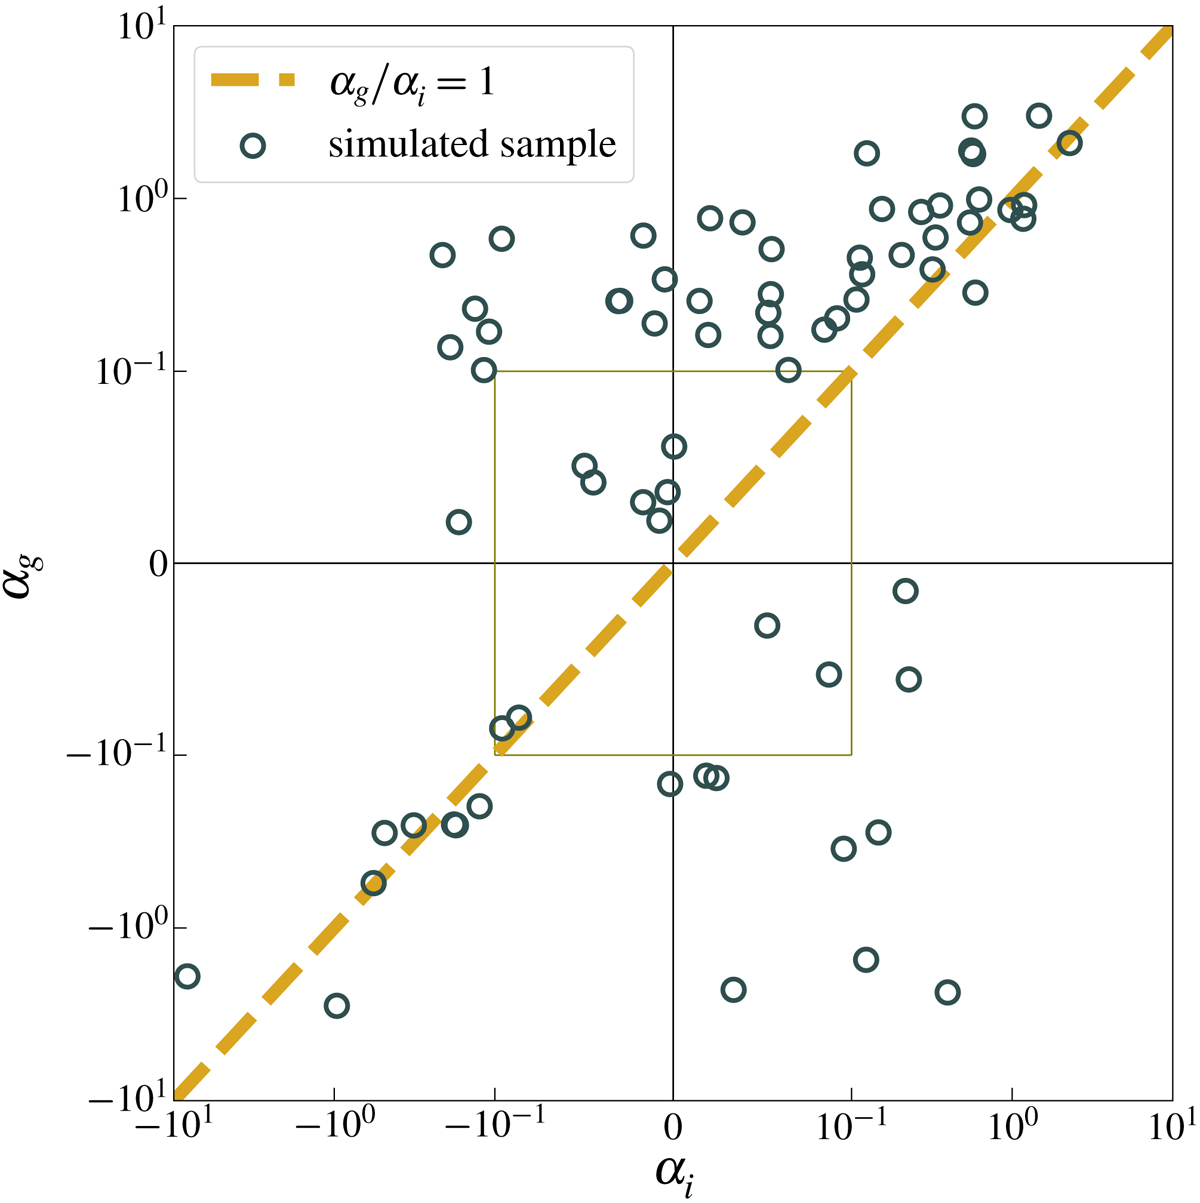
Fig. 7.
Download original image
Lens light residuals can have non-negligible colour gradients. This figure shows the distribution of the g-band and the i-band deviations of the lens light from a Sérsic profile (αg and αi) for the systems in our simulated sample. The dashed line indicates where residuals have no colour gradients (i.e., where αg = αi). The data is plotted linearly within the inner olive box. This figure shows that the deviations of the lens light from a Sérsic profile in different bands are not necessarily correlated.
Current usage metrics show cumulative count of Article Views (full-text article views including HTML views, PDF and ePub downloads, according to the available data) and Abstracts Views on Vision4Press platform.
Data correspond to usage on the plateform after 2015. The current usage metrics is available 48-96 hours after online publication and is updated daily on week days.
Initial download of the metrics may take a while.