Fig. 3.
Download original image
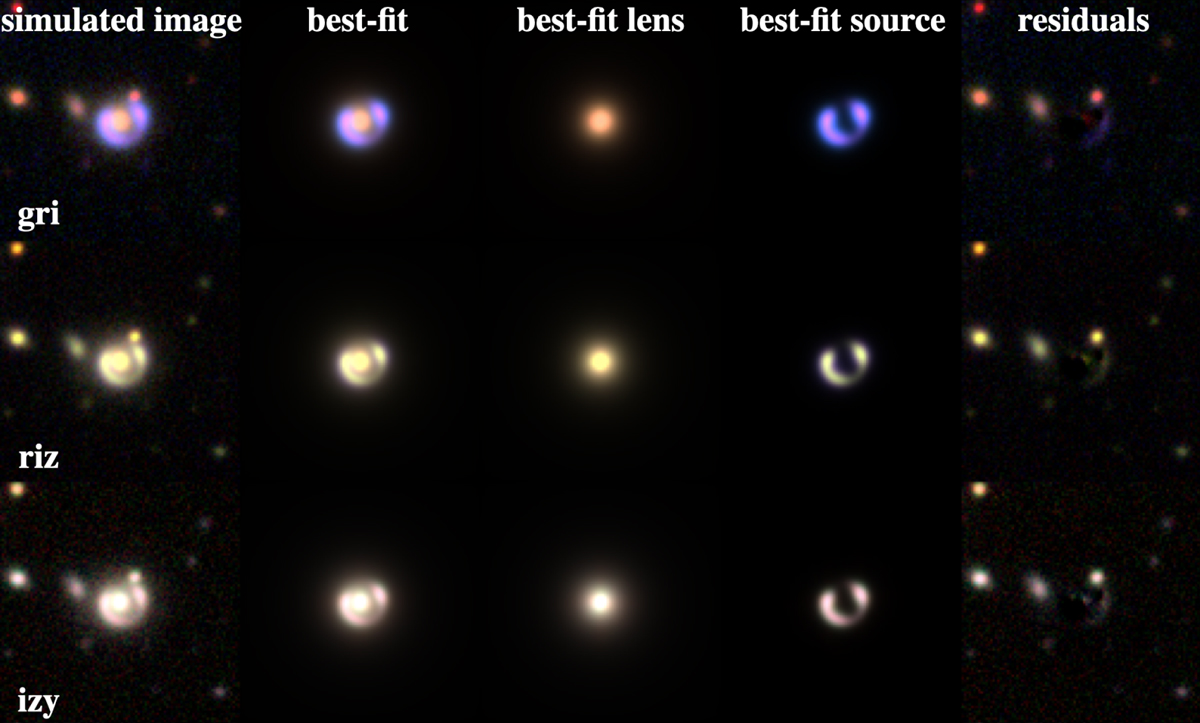
Example of a two-component best-fit model to the grizy images of a simulated strongly lensed galaxy–galaxy system. From top to bottom: colour-composite gri, riz, and izy images. The first column from the left shows the simulated image. The second column shows the PSF-convolved best-fit image. The third and fourth columns show the best-fit lens-only and the best-fit source-only light profiles. The last column shows the residuals (best-fit-subtracted original image). The contaminants were masked by running the SExtractor on the i-band image.
Current usage metrics show cumulative count of Article Views (full-text article views including HTML views, PDF and ePub downloads, according to the available data) and Abstracts Views on Vision4Press platform.
Data correspond to usage on the plateform after 2015. The current usage metrics is available 48-96 hours after online publication and is updated daily on week days.
Initial download of the metrics may take a while.