Fig. A.1.
Download original image
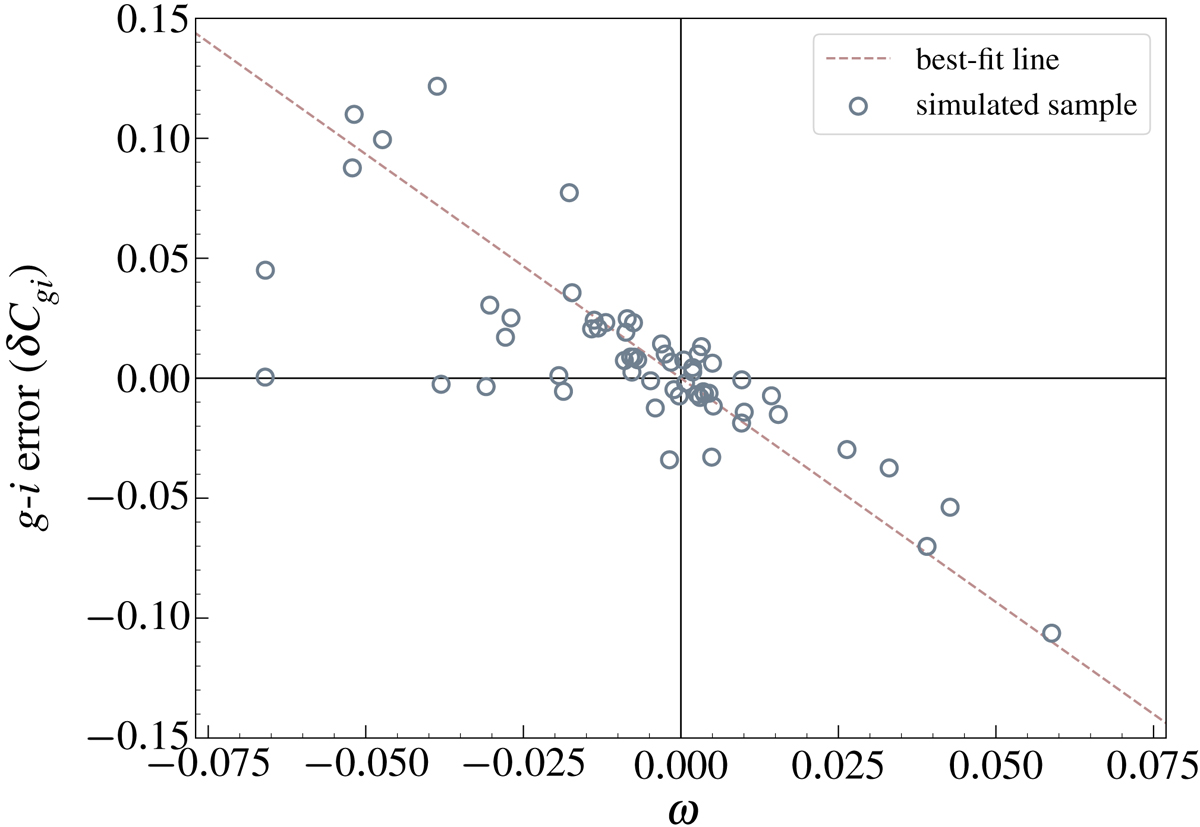
Source colour measurement error correlates with the lens light residuals. This figure shows the error of the measured source g − i colours (δCgi), plotted against the residual ratio parameter (ω, defined in Equations A.1 and A.3). The dashed line shows the best-fit line passing through the origin with a −1.867 ± 0.028 slope. The thin grey lines show the ω = 0 and the δCgi = 0 lines.
Current usage metrics show cumulative count of Article Views (full-text article views including HTML views, PDF and ePub downloads, according to the available data) and Abstracts Views on Vision4Press platform.
Data correspond to usage on the plateform after 2015. The current usage metrics is available 48-96 hours after online publication and is updated daily on week days.
Initial download of the metrics may take a while.