Fig. 10.
Download original image
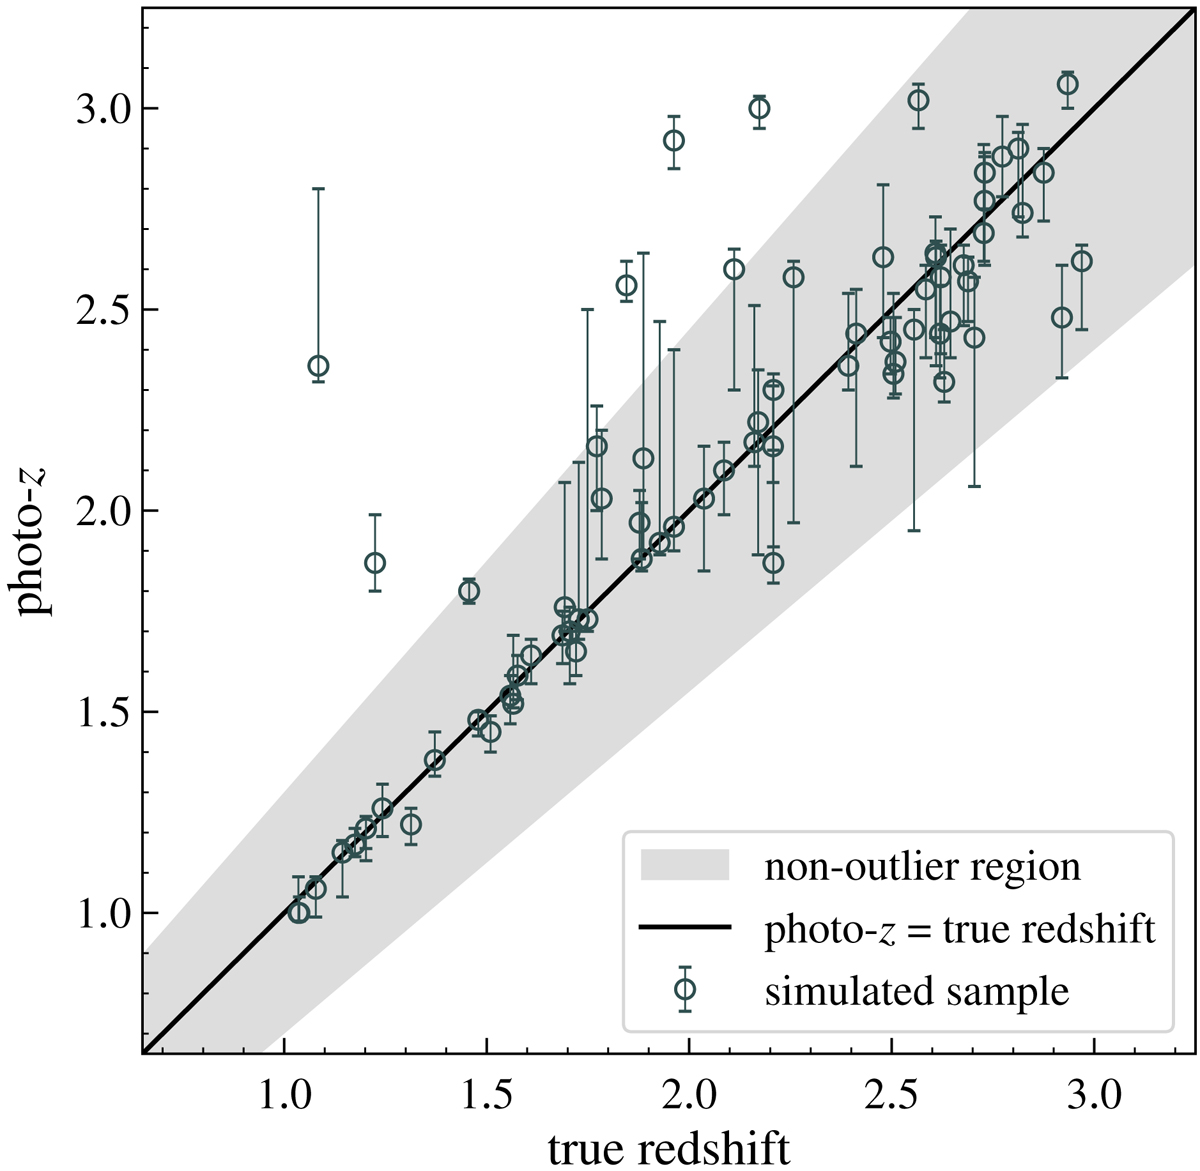
Estimated photo-zs vs. true redshifts for the source galaxies in our simulated sample. The photo-zs were obtained by running the BPZ algorithm on the best-fit colours shown in Fig. 4. The black line shows where the photo-z equals the true redshift. The grey shaded region indicates where δz/(1 + ztrue) < 0.15 (i.e., where the estimated redshift is not an outlier). The outlier fraction (fraction of the cases with δz/(1 + ztrue) > 0.15) is 8.3% and the 1σ scatter of redshift errors (δz/1 + ztrue) is 0.032. As in Fig. 9, the redshift with the highest probability in the redshift PDF was used as the estimated photo-z. The error bars in this figure correspond to the 68th percentile of the redshift PDFs (grey shaded region in Fig. 9.)
Current usage metrics show cumulative count of Article Views (full-text article views including HTML views, PDF and ePub downloads, according to the available data) and Abstracts Views on Vision4Press platform.
Data correspond to usage on the plateform after 2015. The current usage metrics is available 48-96 hours after online publication and is updated daily on week days.
Initial download of the metrics may take a while.