Fig. 4.
Download original image
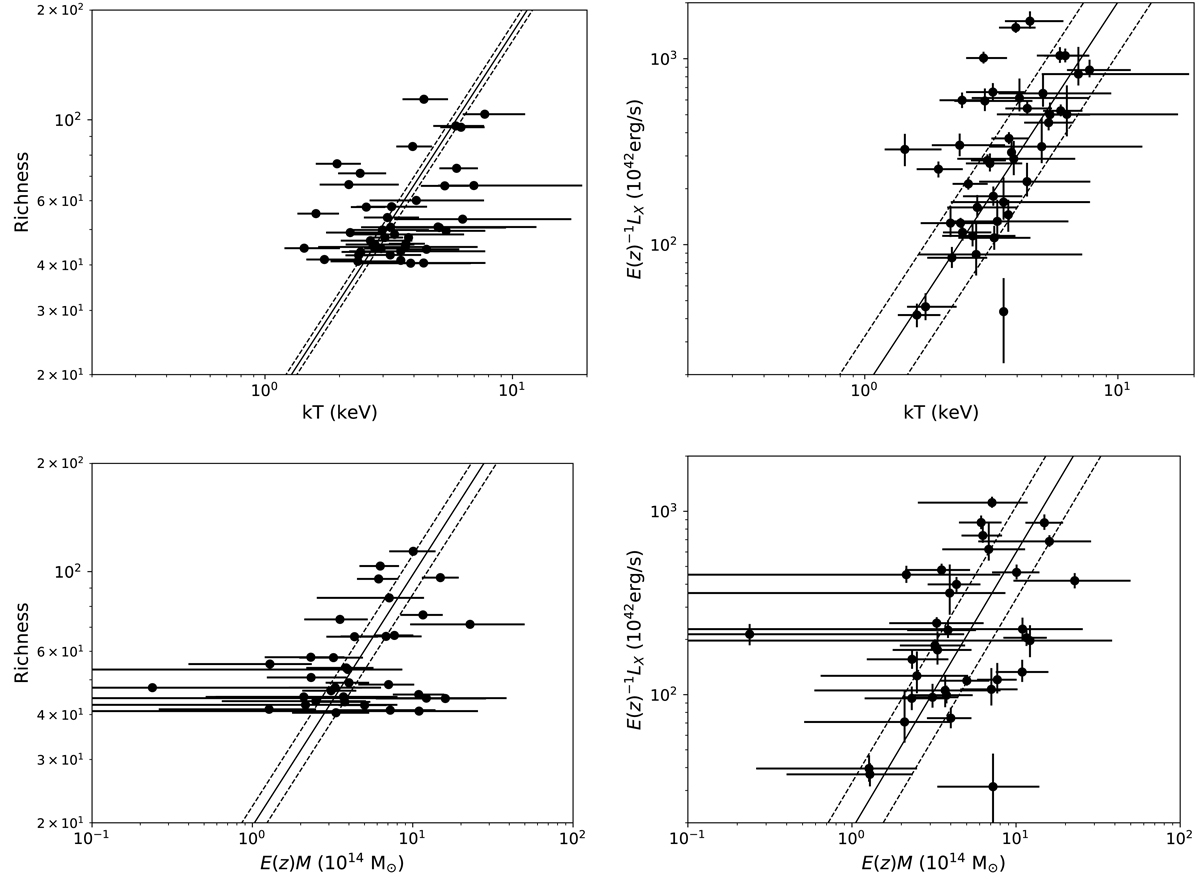
Scaling relations of the high-richness, optically selected clusters (circles). In the upper panels, the simultaneous fit of T − N and T − L relations are shown. In the lower panels, M − N and M − L relations are shown. In each panel, the best-fit power-law model and the 1σ uncertainty around the mean relation are indicated with the solid and dashed lines, respectively.
Current usage metrics show cumulative count of Article Views (full-text article views including HTML views, PDF and ePub downloads, according to the available data) and Abstracts Views on Vision4Press platform.
Data correspond to usage on the plateform after 2015. The current usage metrics is available 48-96 hours after online publication and is updated daily on week days.
Initial download of the metrics may take a while.