Fig. 2.
Download original image
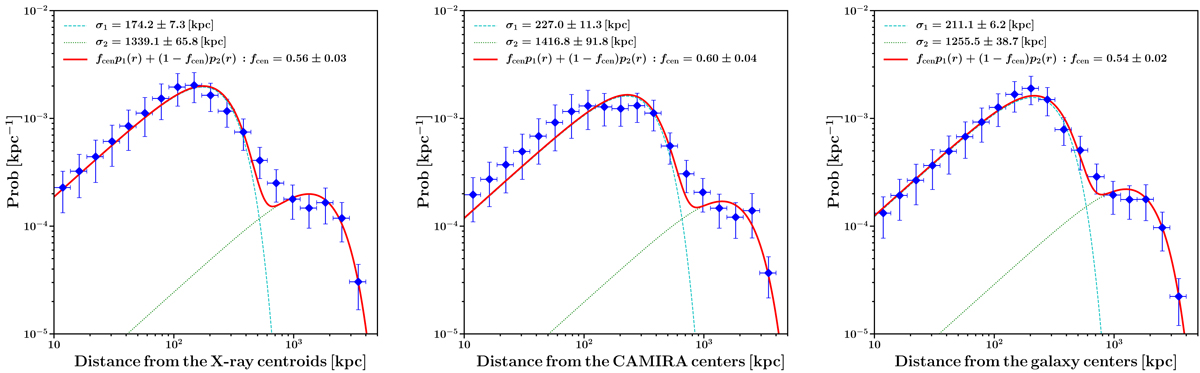
Histograms of the projected distance between 2D weak-lensing mass center and X-ray centroid (left), CAMIRA center (middle), galaxy map peak (right) for 23 CAMIRA clusters. The error bars indicate the statistical uncertainties. The best-fit model (red) consisting of the first and second Gaussian components is indicated by the cyan dashed, and green dotted curves, respectively.
Current usage metrics show cumulative count of Article Views (full-text article views including HTML views, PDF and ePub downloads, according to the available data) and Abstracts Views on Vision4Press platform.
Data correspond to usage on the plateform after 2015. The current usage metrics is available 48-96 hours after online publication and is updated daily on week days.
Initial download of the metrics may take a while.