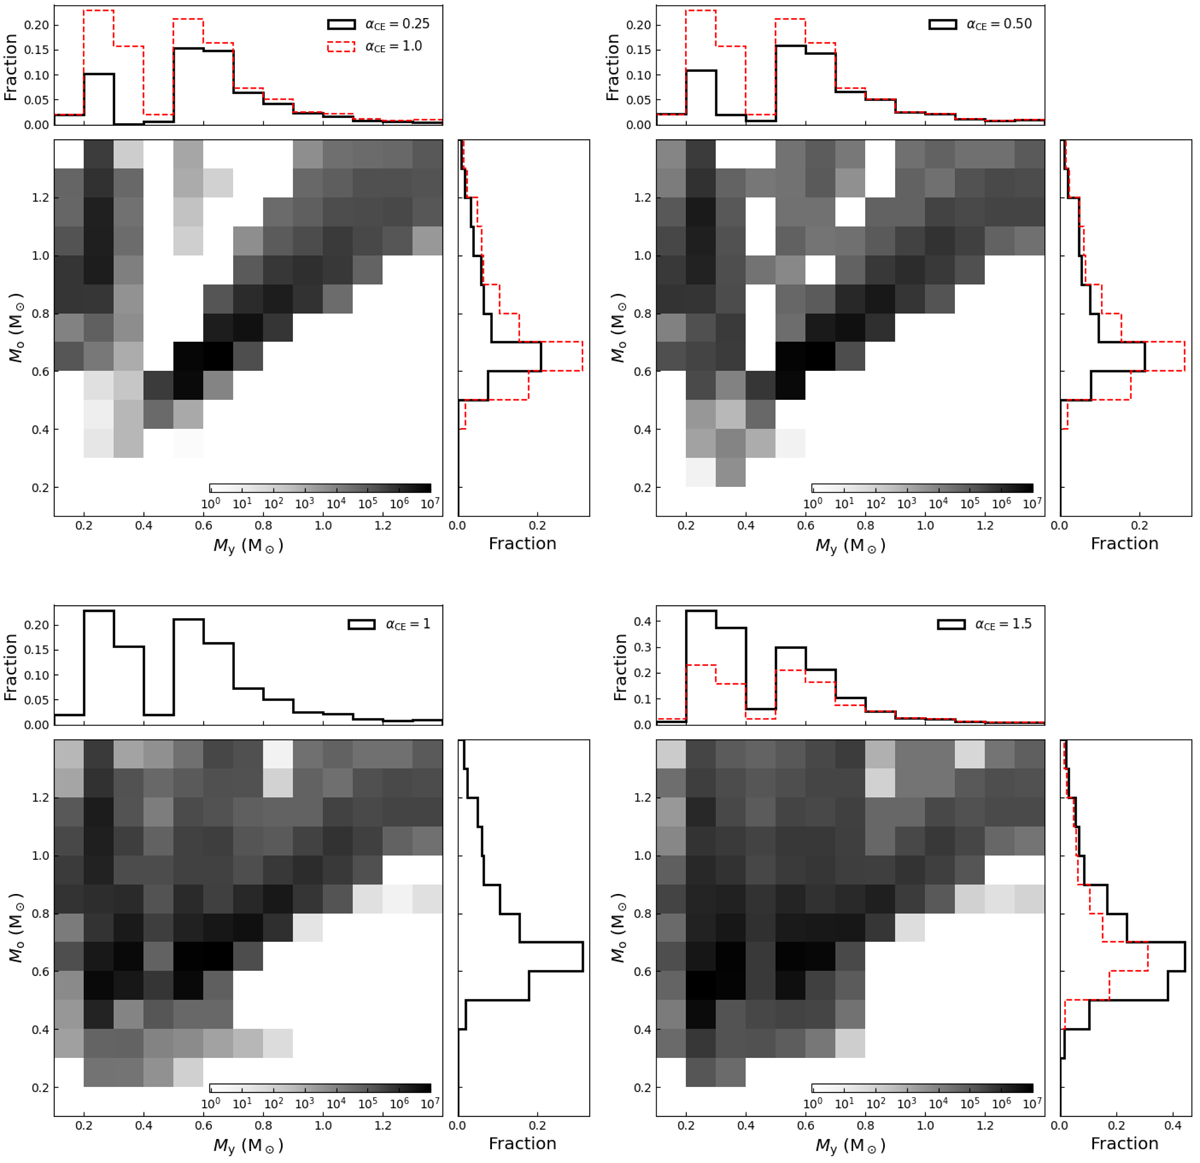
Fig. 6.
Download original image
Number density distribution of DWD masses with various values of αCE in the polytropic model. Details are similar to Fig. 5 but for the polytropic model, where My and Mo represent the mass of the younger and older (the later and former formed) WDs, respectively. We note that the scale of the color bars differs from that of Fig. 5.
Current usage metrics show cumulative count of Article Views (full-text article views including HTML views, PDF and ePub downloads, according to the available data) and Abstracts Views on Vision4Press platform.
Data correspond to usage on the plateform after 2015. The current usage metrics is available 48-96 hours after online publication and is updated daily on week days.
Initial download of the metrics may take a while.