Fig. 4.
Download original image
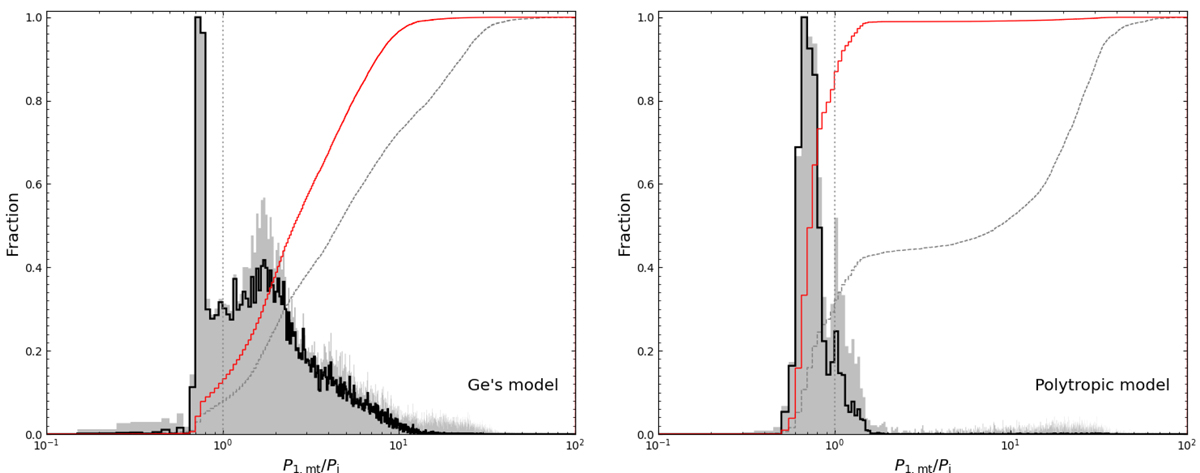
Properties of the period change after the first stable mass transfer phase. The period change distributions for binaries that produce DWDs in the current Galaxy are shown in the black histogram, and the corresponding cumulative distributions are shown in red solid lines. Left and right panels are for Ge’s and polytropic models, respectively. Here, P1, mt refers to the orbital period after the termination of the first mass transfer phase and Pi is the initial orbital period of primordial binary. We note that most binaries with P1, mt/Pi > 1 would enter into the CE processes in the subsequent evolution and some of the resulted DWDs have very short orbital periods (merge within the Hubble timescale). The DWD mergers lead to the decrease of the number for binaries with P1, mt/Pi > 1. The results without considering the DWD mergers are shown in grey histograms and grey dashed lines. It is clear that the number of DWDs with very short orbital periods decreases a lot due to the DWD mergers. For binaries experiencing CE processes in the first mass transfer phase, the period changes of P1, mt/Pi is less than 0.05, which are not shown for concision.
Current usage metrics show cumulative count of Article Views (full-text article views including HTML views, PDF and ePub downloads, according to the available data) and Abstracts Views on Vision4Press platform.
Data correspond to usage on the plateform after 2015. The current usage metrics is available 48-96 hours after online publication and is updated daily on week days.
Initial download of the metrics may take a while.