Open Access
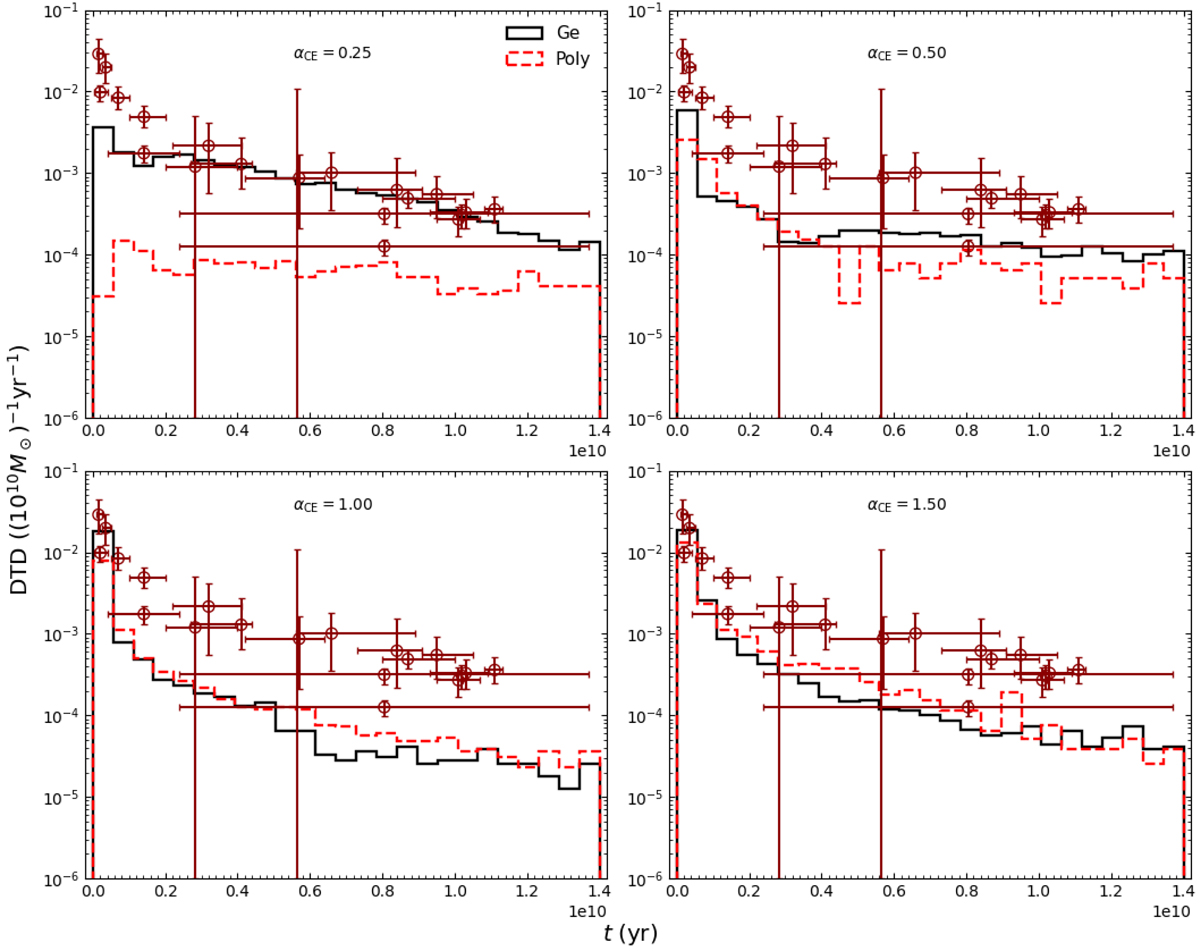
Fig. 14.
Download original image
DTDs of SNe Ia with different αCE. The open circles with error bars represent the observation SNe Ia rate from elliptical galaxies and galaxy clusters (Totani et al. 2008; Maoz et al. 2010, 2012; Graur & Maoz 2013). Black solid and red dashed lines are for Ge’s and polytropic models, respectively.
Current usage metrics show cumulative count of Article Views (full-text article views including HTML views, PDF and ePub downloads, according to the available data) and Abstracts Views on Vision4Press platform.
Data correspond to usage on the plateform after 2015. The current usage metrics is available 48-96 hours after online publication and is updated daily on week days.
Initial download of the metrics may take a while.