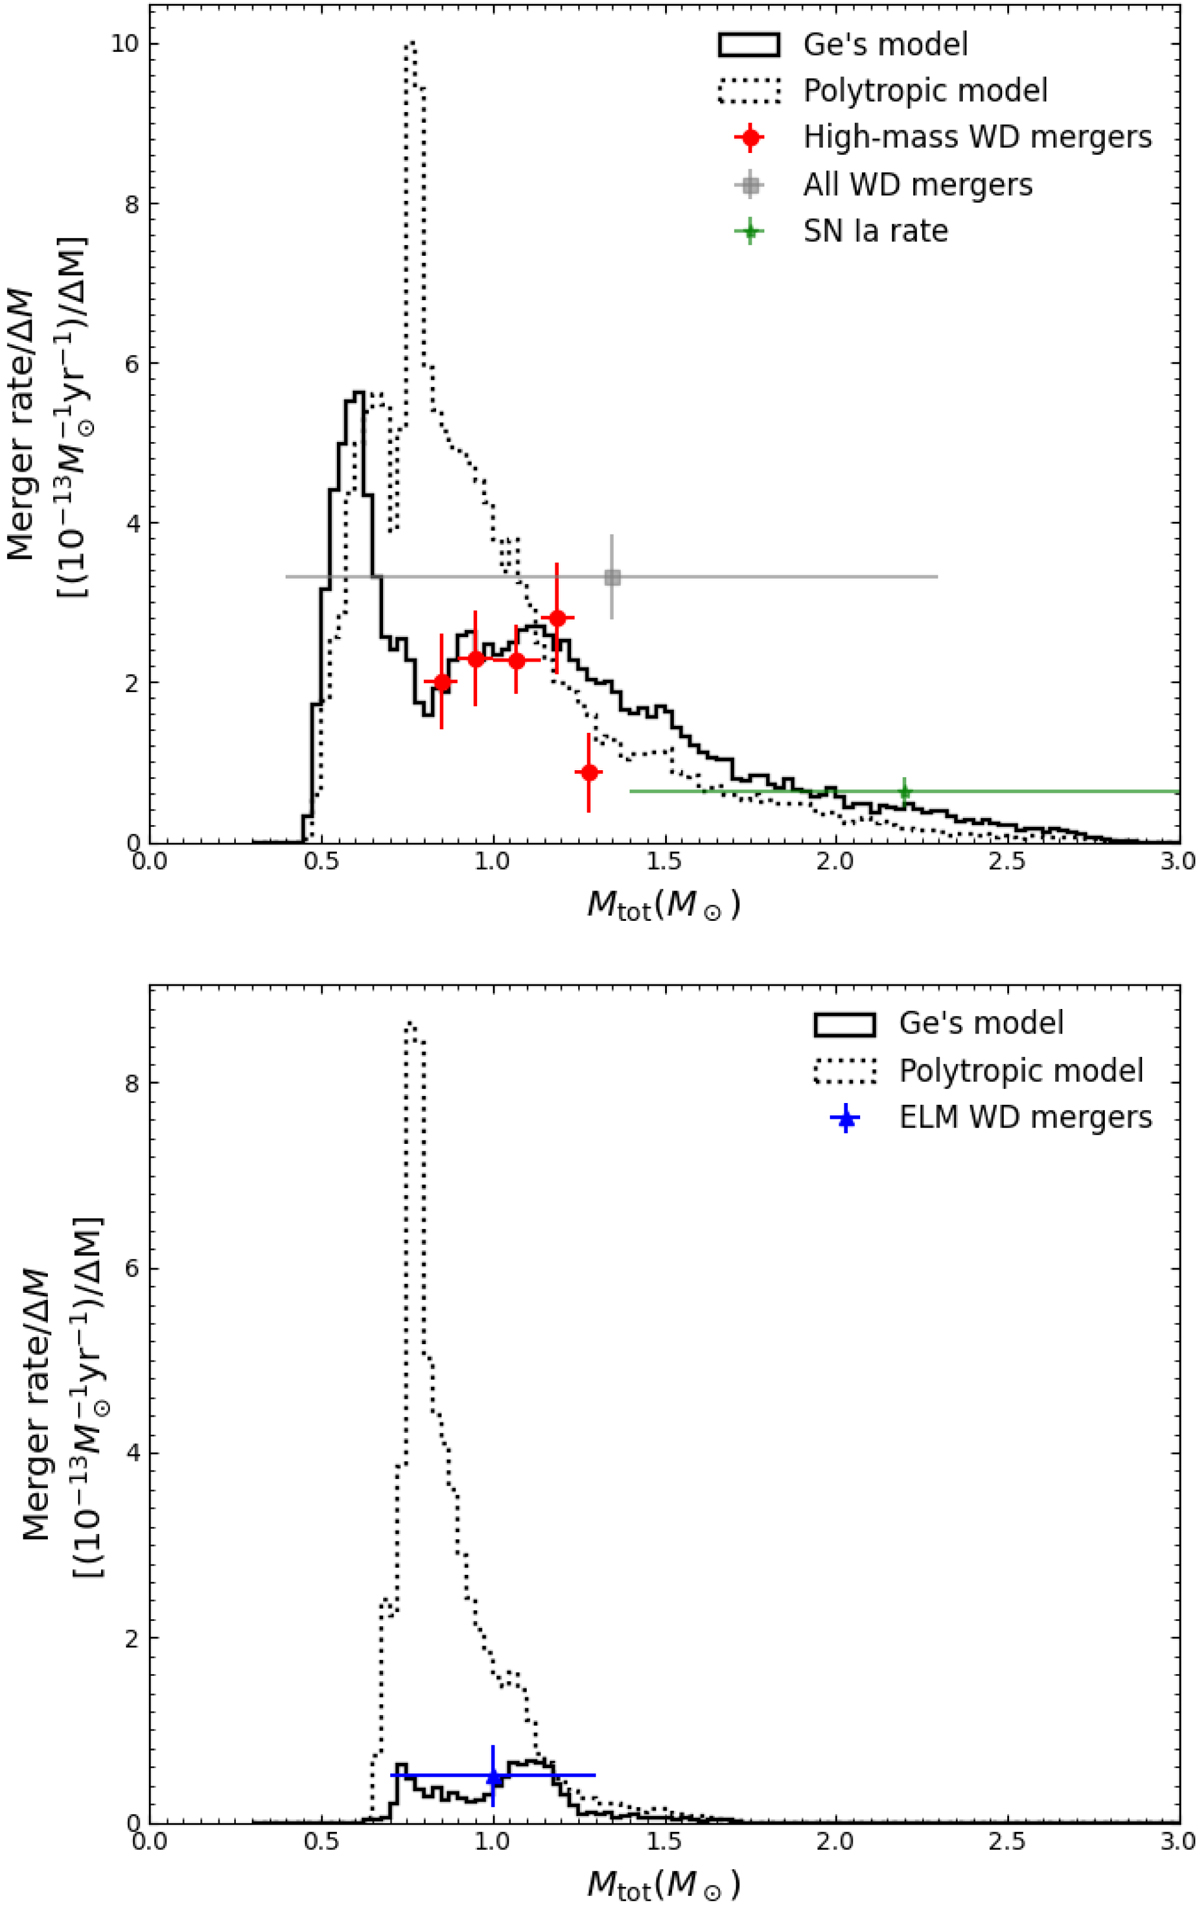
Fig. 11.

Download original image
Merger rate distribution as a function of the merger mass for all DWD mergers (upper panel). Black solid and dotted lines are for Ge’s and polytropic models, respectively. The red circles represent the DWD mergers that produce 0.8 − 1.32 M⊙ WDs (Cheng et al. 2020), the blue one is for the ELM WD mergers (Brown et al. 2020), the grey one is for all DWD mergers (Maoz et al. 2018), and the blue stars show the observed SN Ia rate (Li et al. 2011). We note that the merger rate is divided by ΔM, where ΔM equals the bin size (0.025 M⊙) in the simulations and equals the horizontal error bar of the data points. Comparisons between a data point and the histogram should be made in terms of the area under the horizontal error bar of the data point and the area under the histogram in the same mass range. The ELM WD is defined as He WD with mass ≤0.30 M⊙, and its companion is assumed to be CO WD (≥0.45 M⊙), which is the most common companion type found in ELM Survey (shown in the lower panel).
Current usage metrics show cumulative count of Article Views (full-text article views including HTML views, PDF and ePub downloads, according to the available data) and Abstracts Views on Vision4Press platform.
Data correspond to usage on the plateform after 2015. The current usage metrics is available 48-96 hours after online publication and is updated daily on week days.
Initial download of the metrics may take a while.


