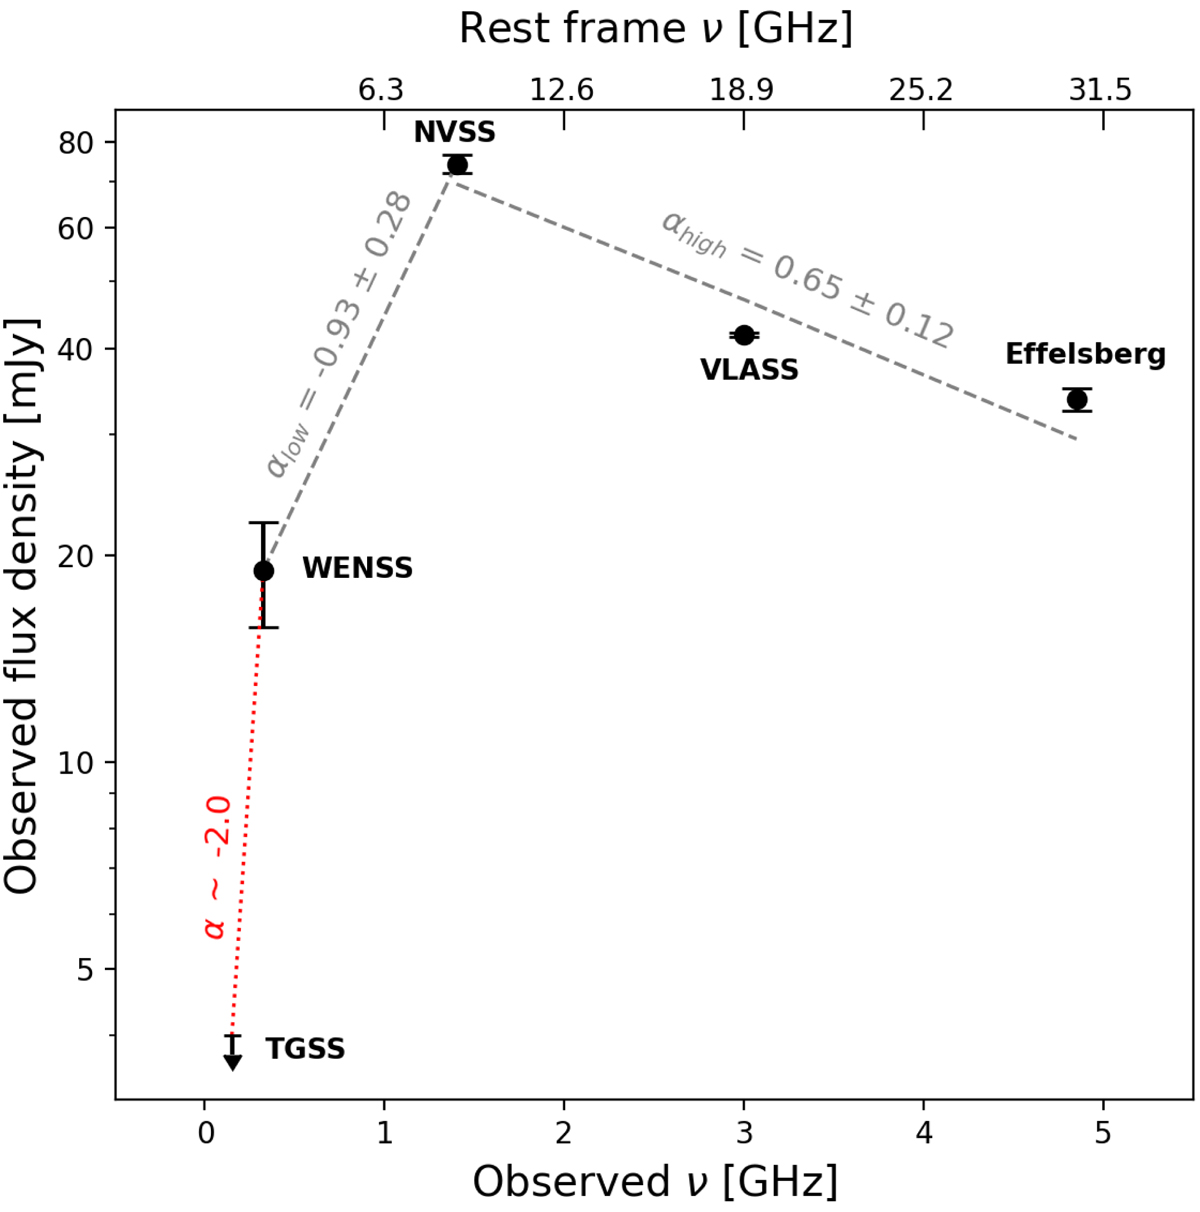
Fig. 7.

Download original image
Radio flux densities as a function of the observed (bottom x-axis) and rest-frame (top x-axis) frequency of PSO J191+86 from 0.150 to 4.85 GHz. The spectrum shows a peak around ∼1 GHz, and therefore the source can be classified as a GPS. The corresponding indices of the low- and high-frequency parts of the spectrum are reported together with the reference surveys. The red dashed line represents the possible spectral index according to the TGSS upper limit.
Current usage metrics show cumulative count of Article Views (full-text article views including HTML views, PDF and ePub downloads, according to the available data) and Abstracts Views on Vision4Press platform.
Data correspond to usage on the plateform after 2015. The current usage metrics is available 48-96 hours after online publication and is updated daily on week days.
Initial download of the metrics may take a while.


