Fig. 6.
Download original image
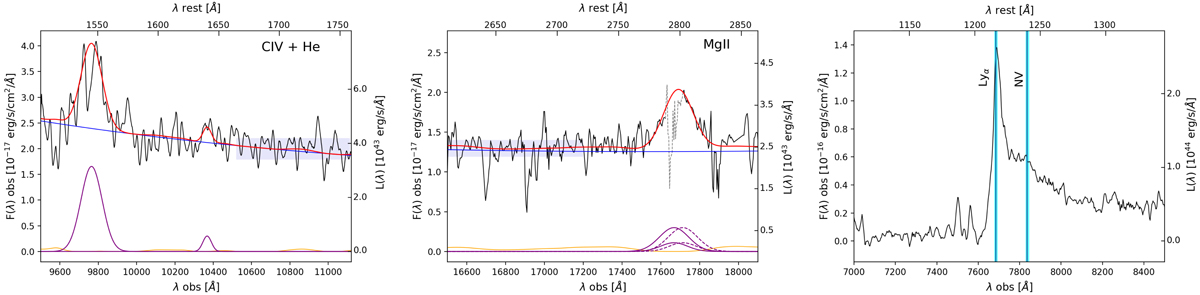
Zoom into the CIV and MgII line fit and into the Lyα+NV region. Left and central panel: total spectral fit (red line), and the different components, i.e., power law + Balmer pseudo-continuum (blue line), Fe II template (orange line, from Vestergaard & Wilkes 2001), and emission lines (purple). For the MgII, we represent the two lines of the doublet (solid Gaussians and dashed Gaussians, respectively). Spectral regions used for the continuum fits are shown as horizontal light blue shaded areas. In the right panel, the absorption feature in the middle of the MgII line is masked (gray dotted line). Right panel: Lyα and NV spectral region. The blue vertical lines represent the positions of the two BELs based on the MgII line redshift. The cyan shaded region is the uncertainty on this redshift estimate. The top x-axis reports the rest-frame wavelengths while the right axis shows the monochromatic luminosity.
Current usage metrics show cumulative count of Article Views (full-text article views including HTML views, PDF and ePub downloads, according to the available data) and Abstracts Views on Vision4Press platform.
Data correspond to usage on the plateform after 2015. The current usage metrics is available 48-96 hours after online publication and is updated daily on week days.
Initial download of the metrics may take a while.