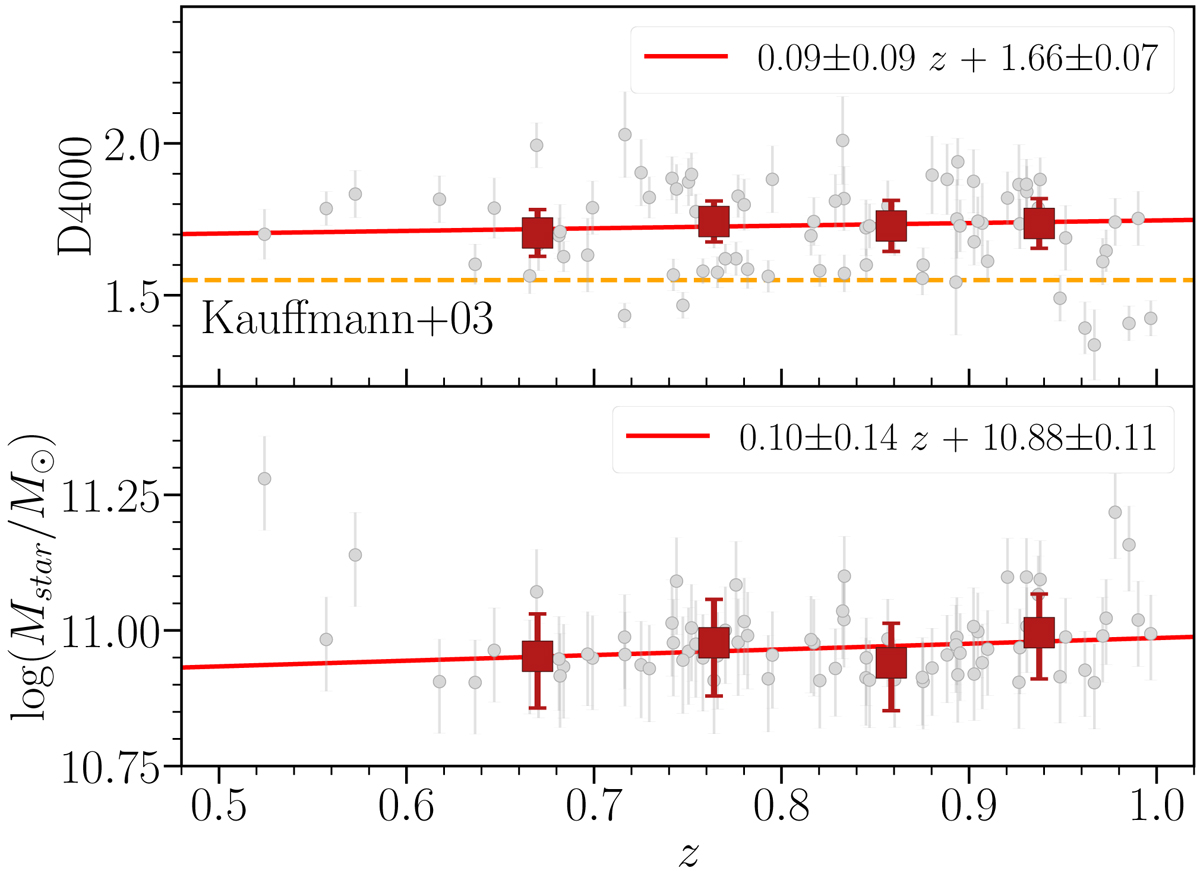
Fig. 6.
Download original image
Relation of D4000 vs. z (top panel) and Mstar vs. z (bottom panel). The grey points represent the 77 red nuggets and the red squares represent the median value in every redshift bin (see Table 4). The red line is the best linear fit. The dashed orange line represents D4000 equals 1.55, which is the passiveness limit derived by Kauffmann et al. (2003a) in the local Universe.
Current usage metrics show cumulative count of Article Views (full-text article views including HTML views, PDF and ePub downloads, according to the available data) and Abstracts Views on Vision4Press platform.
Data correspond to usage on the plateform after 2015. The current usage metrics is available 48-96 hours after online publication and is updated daily on week days.
Initial download of the metrics may take a while.