Fig. 5.
Download original image
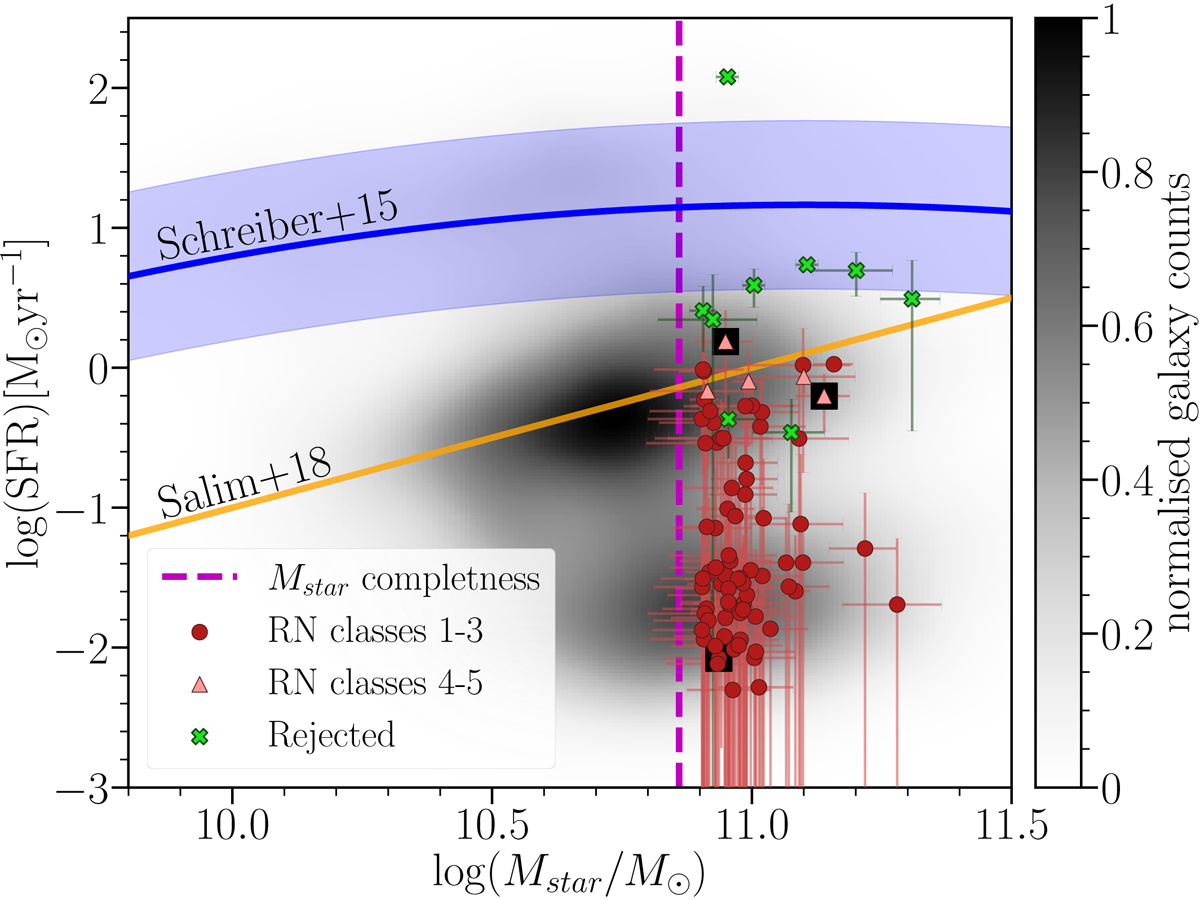
Relation of SFR vs. stellar mass. In the smoothed background the sample of 6961 UCMG candidates is shown. The points represent our 86 red and green UCMGs. Red circles and pink triangles indicate VIPERS red nuggets (RN), while green crosses correspond to the UCMGs that we considered as active. The orange line shows the limit for passive galaxies (Salim et al. 2018). The blue line shows the main sequence of galaxies according to Schreiber et al. (2015). The magenta dashed line shows the mass completeness at redshift z = 0.9 for passive galaxies equal to log(Mstar/M⊙)∼10.86 according to Davidzon et al. (2016). The three sources with relative errors higher than 45% are indicated as black squares.
Current usage metrics show cumulative count of Article Views (full-text article views including HTML views, PDF and ePub downloads, according to the available data) and Abstracts Views on Vision4Press platform.
Data correspond to usage on the plateform after 2015. The current usage metrics is available 48-96 hours after online publication and is updated daily on week days.
Initial download of the metrics may take a while.