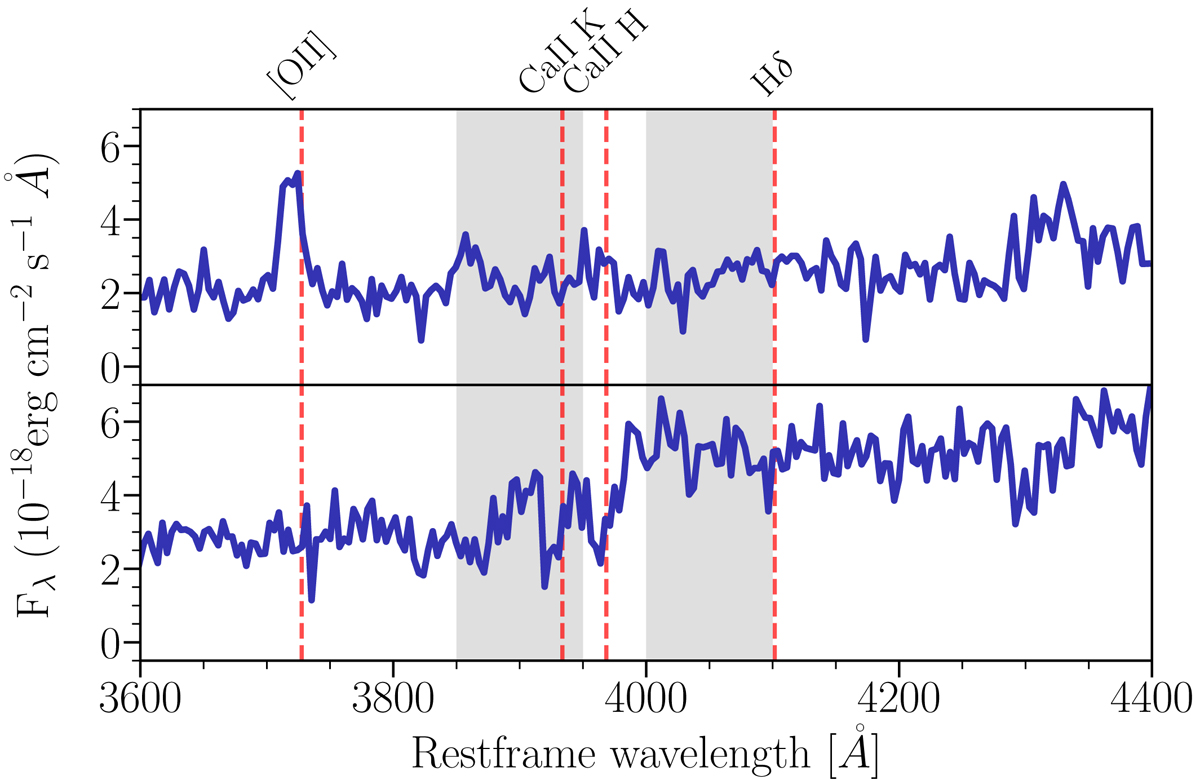
Fig. 4.
Download original image
Example spectra of galaxies. The upper panel shows a possible star-forming galaxy, while the bottom panel shows a likely passive galaxy. The red dashed lines (left to right) show the [OII] emision line (3727.5 Å), calcium K (3933.7 Å), calcium H (3968.5 Å), and Hδ (4101.7 Å). The grey shadings correspond to regions used for D4000 calculation (Balogh et al. 1999).
Current usage metrics show cumulative count of Article Views (full-text article views including HTML views, PDF and ePub downloads, according to the available data) and Abstracts Views on Vision4Press platform.
Data correspond to usage on the plateform after 2015. The current usage metrics is available 48-96 hours after online publication and is updated daily on week days.
Initial download of the metrics may take a while.