Fig. 3.
Download original image
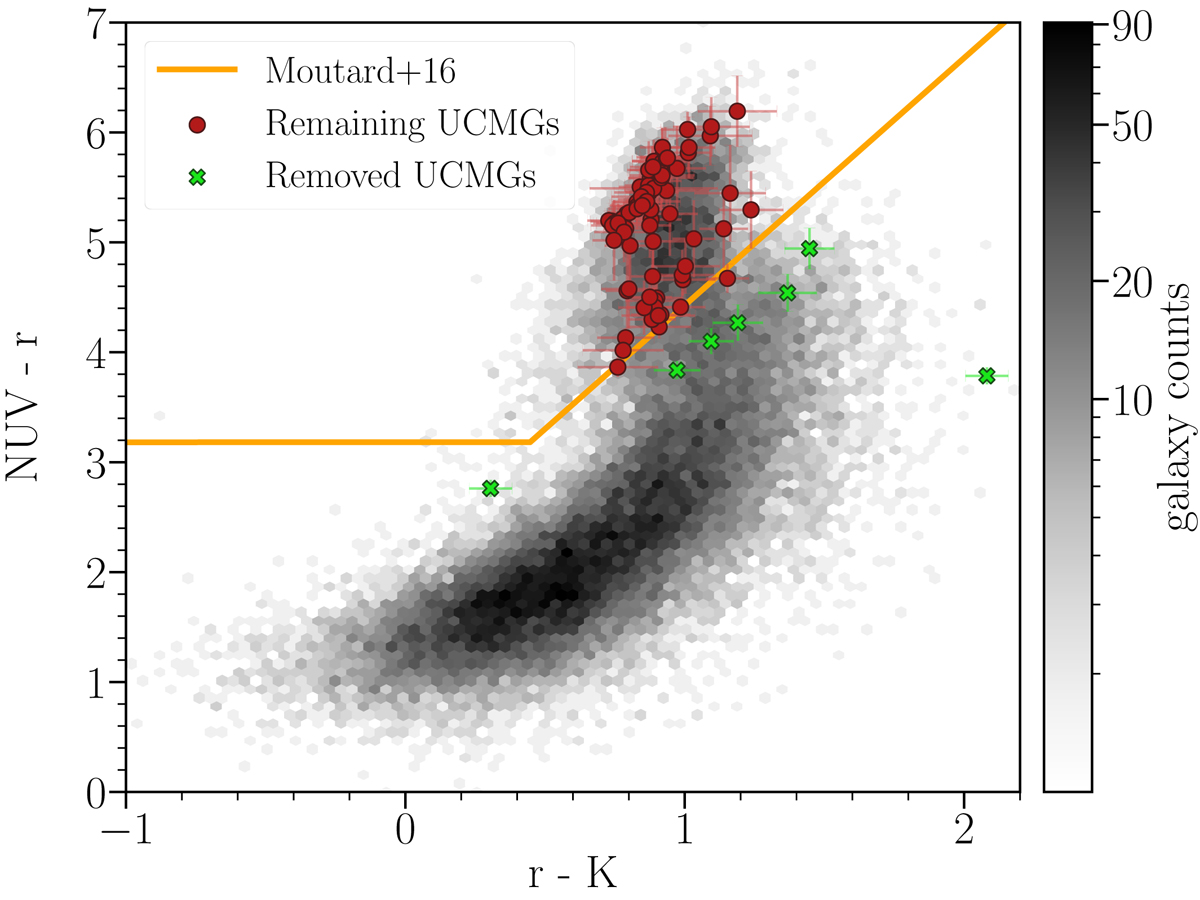
NUVrK diagram. The distribution of 36 157 galaxies (pure sample) is shown in the background. The orange line, shows the limit for red galaxies adapted from Moutard et al. (2016b). The red and the green points represent the VIPERS UCMGs sample. Sources indicated by green crosses are thought to be blue (active), and have been removed from our sample.
Current usage metrics show cumulative count of Article Views (full-text article views including HTML views, PDF and ePub downloads, according to the available data) and Abstracts Views on Vision4Press platform.
Data correspond to usage on the plateform after 2015. The current usage metrics is available 48-96 hours after online publication and is updated daily on week days.
Initial download of the metrics may take a while.