Fig. 4.

Download original image
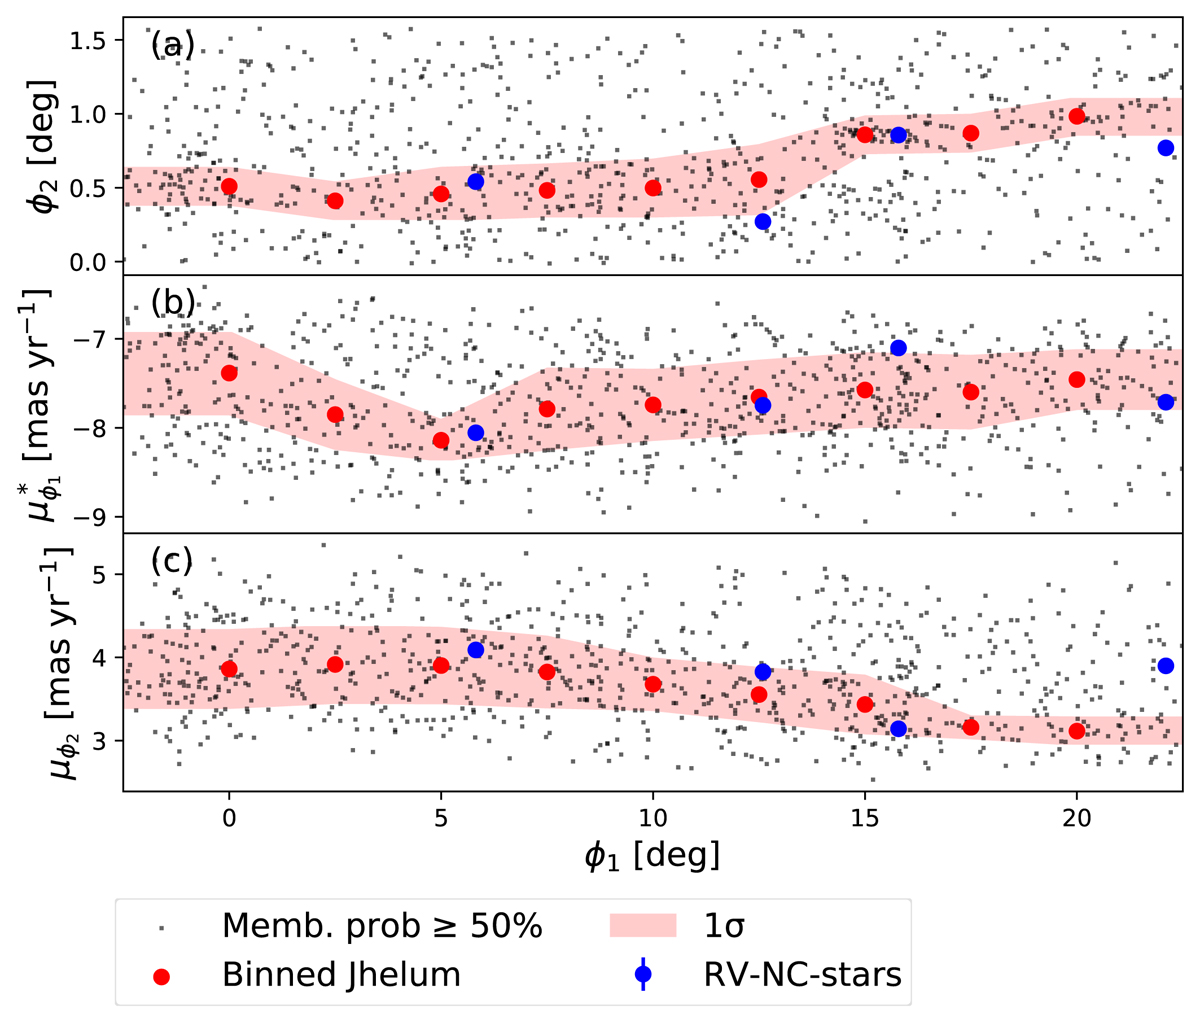
Distribution of high probability narrow component members (> 50%) in (a), (ϕ1, ϕ2), (b), (ϕ1, ![]() ) and (c), (ϕ1, μϕ2). The resulting binned tracks and their 1σ uncertainty ranges are indicated in red. The RV-NC-stars are overplotted in blue, together with their measurement uncertainties (which are too small to be seen). Most RV-NC-stars follow the tracks roughly within the 1σ range, except for the RV-NC-star Jhelum2_14 located at ϕ1 ≈ 22 deg.
) and (c), (ϕ1, μϕ2). The resulting binned tracks and their 1σ uncertainty ranges are indicated in red. The RV-NC-stars are overplotted in blue, together with their measurement uncertainties (which are too small to be seen). Most RV-NC-stars follow the tracks roughly within the 1σ range, except for the RV-NC-star Jhelum2_14 located at ϕ1 ≈ 22 deg.
Current usage metrics show cumulative count of Article Views (full-text article views including HTML views, PDF and ePub downloads, according to the available data) and Abstracts Views on Vision4Press platform.
Data correspond to usage on the plateform after 2015. The current usage metrics is available 48-96 hours after online publication and is updated daily on week days.
Initial download of the metrics may take a while.


