Fig. 3.
Download original image
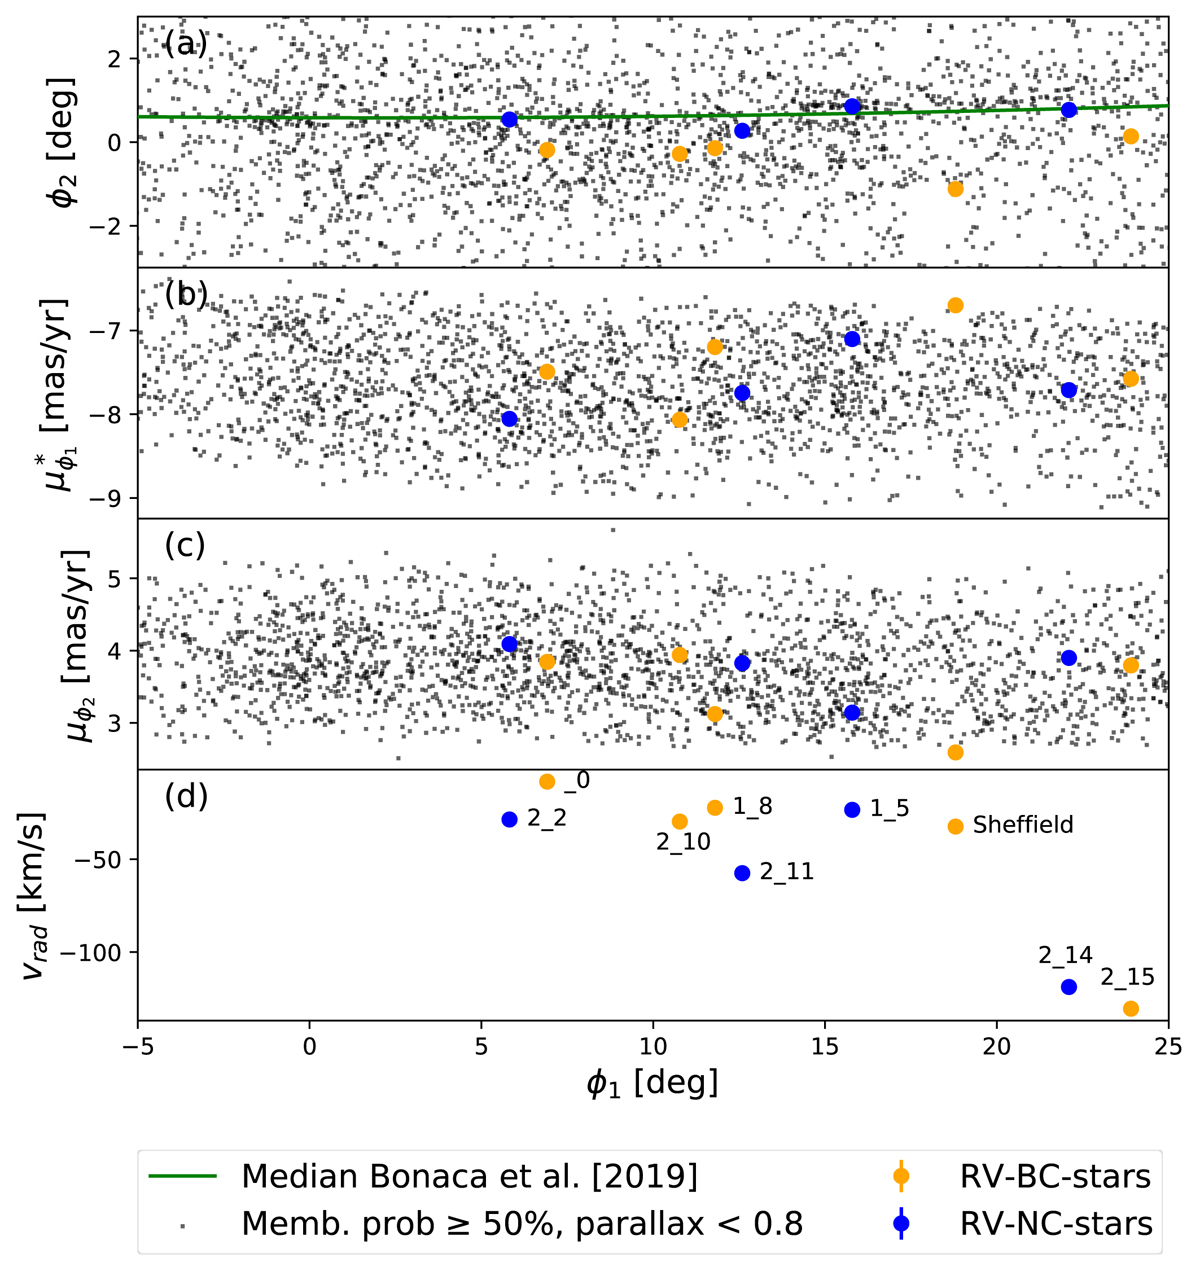
Stars with a membership probability larger than 50%, parallax < 0.8 mas and 5 ≤ ϕ1/deg ≤ 25, −3 ≤ ϕ2/deg ≤ 3 are shown as black dots in (panel a) on the sky (ϕ1, ϕ2), in (b) in (ϕ1, ![]() ) and in (panel c), (ϕ1, μϕ2). The RV-NC-stars are overplotted in blue, the RV-BC-stars in orange. Panel d: the radial velocities of the RV-NC-stars and RV-BC-stars, where the labels indicate the notation used for the JhelumX_Y stars. The measured uncertainties in position, PM and radial velocity for the RV-NC-stars and RV-BC-stars are plotted as errorbars, but are too small to be seen. The green curve in the top panel shows the median track (Eq. (1)) from Bonaca et al. (2019b).
) and in (panel c), (ϕ1, μϕ2). The RV-NC-stars are overplotted in blue, the RV-BC-stars in orange. Panel d: the radial velocities of the RV-NC-stars and RV-BC-stars, where the labels indicate the notation used for the JhelumX_Y stars. The measured uncertainties in position, PM and radial velocity for the RV-NC-stars and RV-BC-stars are plotted as errorbars, but are too small to be seen. The green curve in the top panel shows the median track (Eq. (1)) from Bonaca et al. (2019b).
Current usage metrics show cumulative count of Article Views (full-text article views including HTML views, PDF and ePub downloads, according to the available data) and Abstracts Views on Vision4Press platform.
Data correspond to usage on the plateform after 2015. The current usage metrics is available 48-96 hours after online publication and is updated daily on week days.
Initial download of the metrics may take a while.