Fig. 2.
Download original image
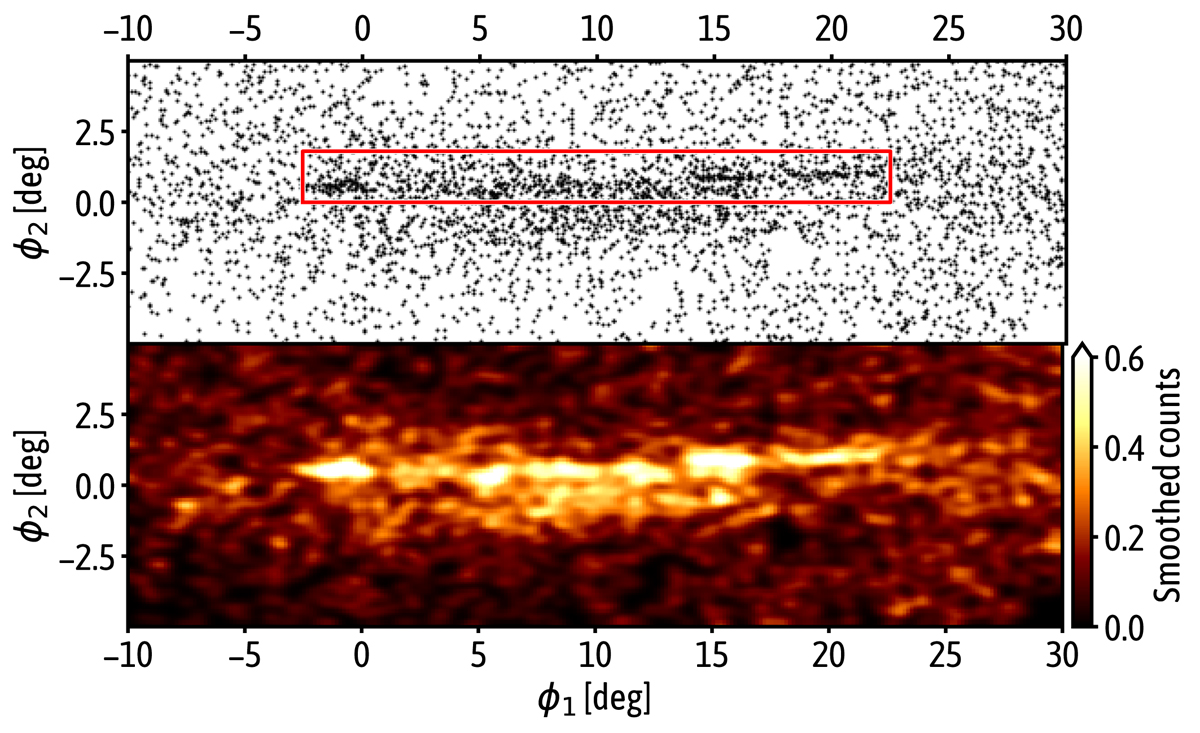
Positions in (ϕ1, ϕ2) of stars with a membership probability larger than 50% and parallax < 0.8 mas displayed as a scatter plot (top) and a smoothed density map (bottom). Jhelum clearly stands out as an overdensity and has a clumpy morphology with multiple gaps. Possible narrow-component members are contained within the red region in the top panel. Below this region, the extended broad component stands out, while above it, between ϕ1 ≈ 0–5 degrees, a thus far unreported third component can be seen.
Current usage metrics show cumulative count of Article Views (full-text article views including HTML views, PDF and ePub downloads, according to the available data) and Abstracts Views on Vision4Press platform.
Data correspond to usage on the plateform after 2015. The current usage metrics is available 48-96 hours after online publication and is updated daily on week days.
Initial download of the metrics may take a while.