Fig. B.1.
Download original image
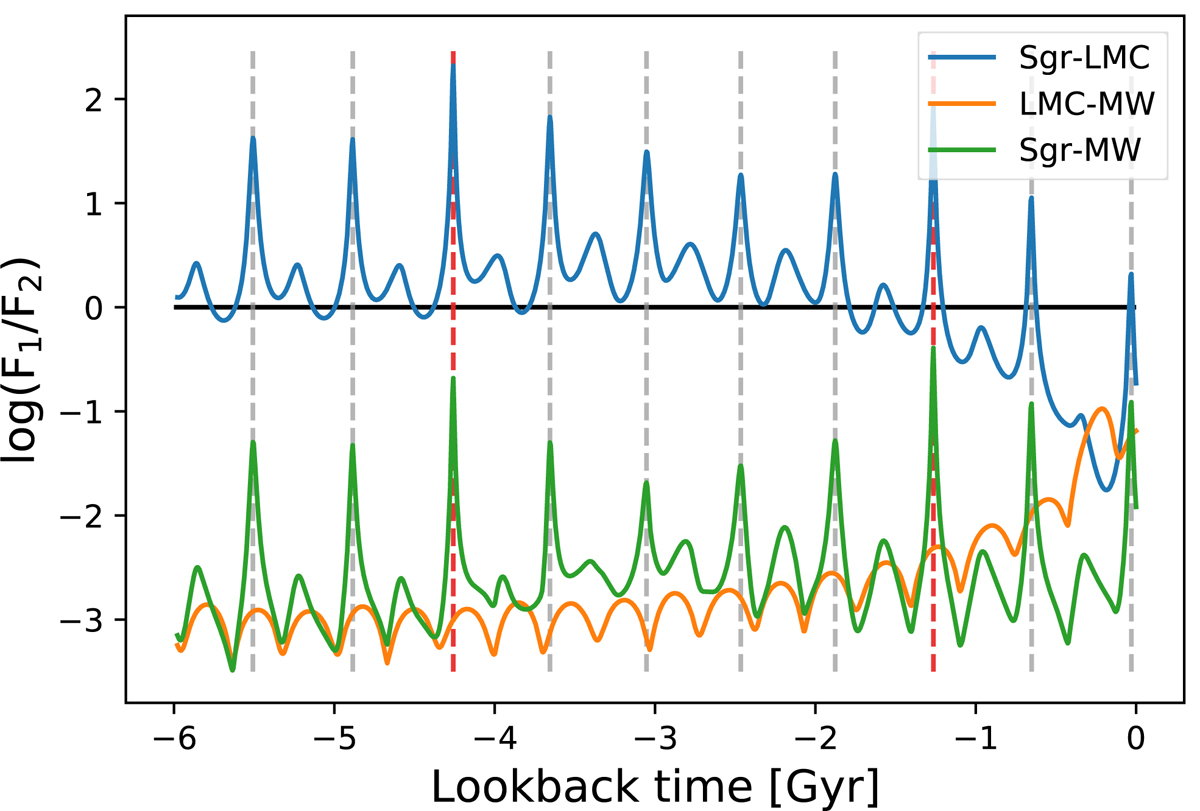
Logarithm of the ratio between forces of Sgr, the LMC and the MW on Jhelum through time for Simulation 2. The blue line shows the ratio between the forces from the LMC and Sgr on Jhelum. The orange (green) line shows the ratio between the force from the LMC (Sgr) and the MW. The vertical dashed lines show minima in the distance between Jhelum and Sgr, with the red dashed vertical lines showing the closest, most impactful interactions from Table 3. The black horizontal line shows where the forces are equal.
Current usage metrics show cumulative count of Article Views (full-text article views including HTML views, PDF and ePub downloads, according to the available data) and Abstracts Views on Vision4Press platform.
Data correspond to usage on the plateform after 2015. The current usage metrics is available 48-96 hours after online publication and is updated daily on week days.
Initial download of the metrics may take a while.