Open Access
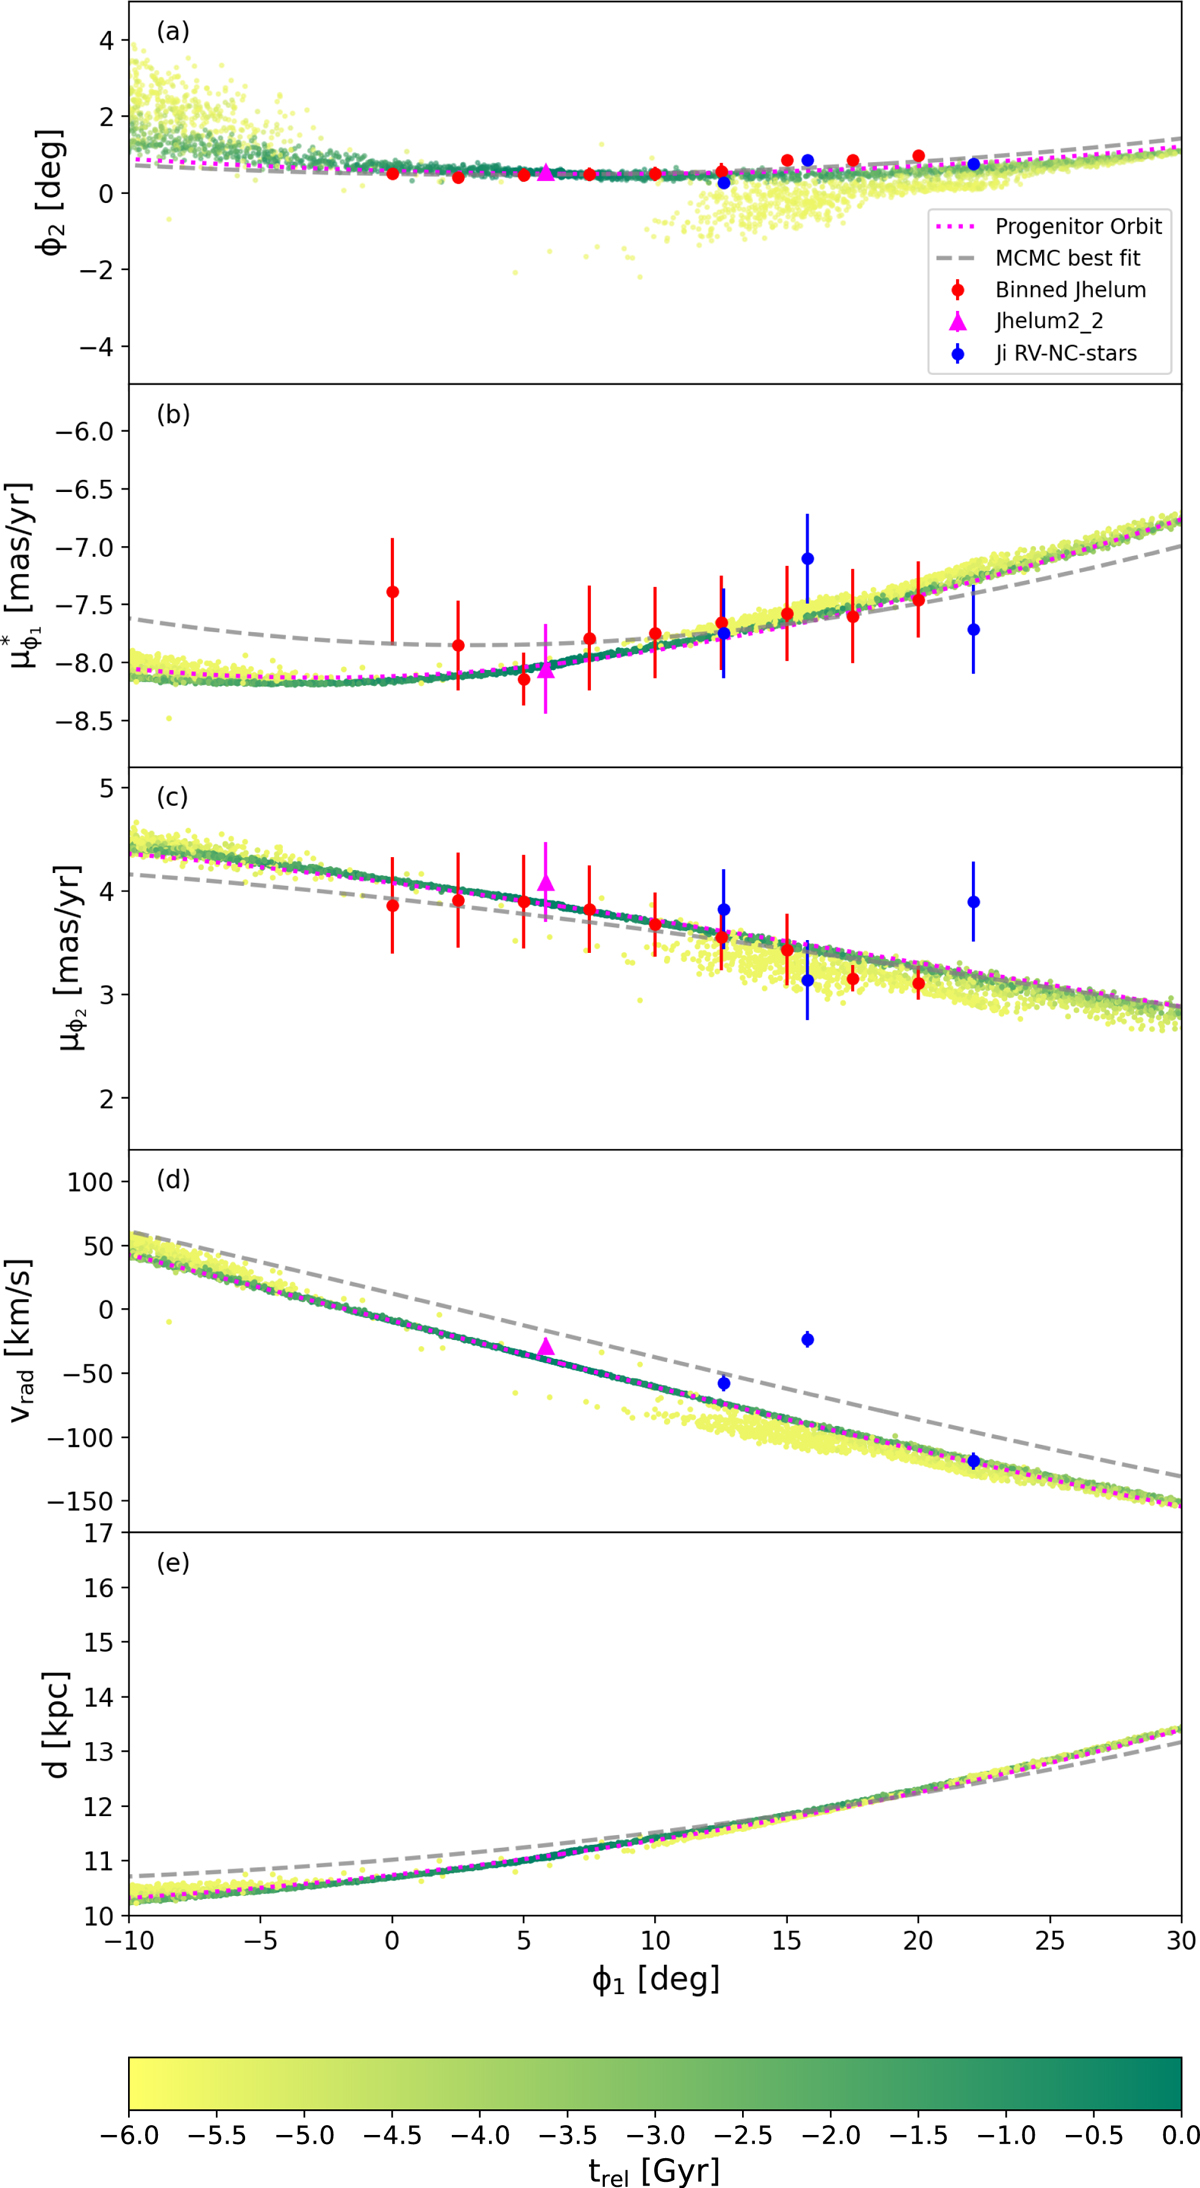
Fig. 11.
Download original image
As Fig. 10, but now for Simulation 2. The bottom component is short, dense and close to the narrow component. To the left, the leading tail shows signs of a diffuse tertiary component that is the result of a ‘folding’.
Current usage metrics show cumulative count of Article Views (full-text article views including HTML views, PDF and ePub downloads, according to the available data) and Abstracts Views on Vision4Press platform.
Data correspond to usage on the plateform after 2015. The current usage metrics is available 48-96 hours after online publication and is updated daily on week days.
Initial download of the metrics may take a while.