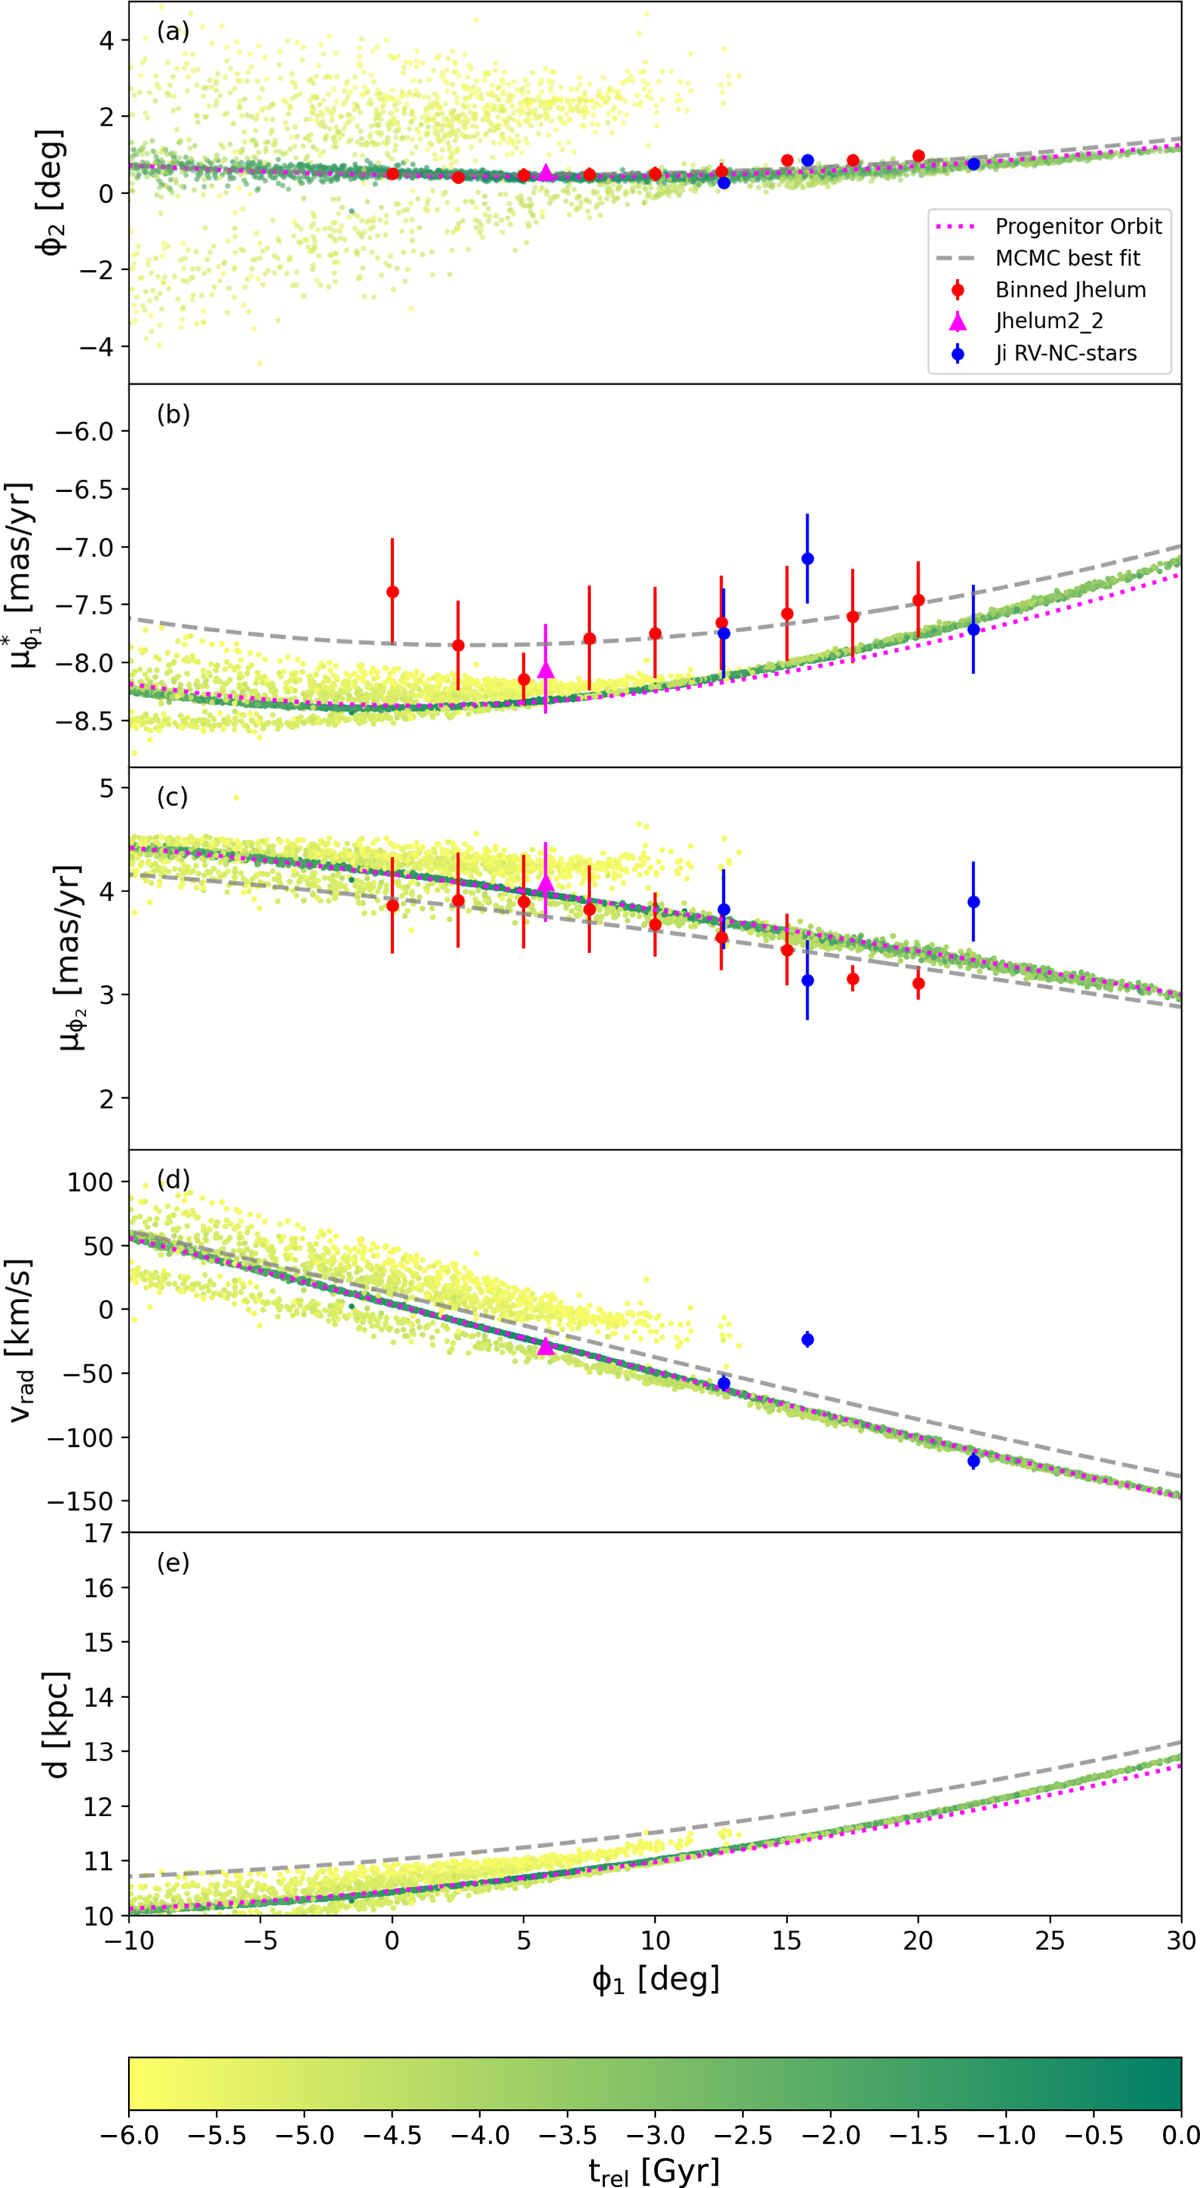
Fig. 10.
Download original image
Simulation 1 of the Jhelum stream after interacting with the Sgr dwarf spheroidal. The individual star particles from Jhelum are colour-coded according to the lookback time at which they became unbound. Panel a: shows the stream in ϕ1-ϕ2 frame, while (panels b) and (c) show the (non-reflex corrected) PM in the ϕ1 and ϕ2 directions respectively. Panel d: radial velocity, and Panel (e) the distance. The red datapoints correspond to the binned Jhelum data from Sect. 2.2, and the blue datapoints correspond to stars from Ji et al. (2020) that are likely members of the narrow component of Jhelum. The magenta triangle corresponds to Jhelum2_2, the datapoint which in our simulations marks the present-day location of the progenitor. The magenta dotted line shows the trajectory of the centre of mass of the Jhelum progenitor, and the grey dashed line shows the result from the MCMC best-fit with σnuis = 6.7 km s−1 from Sect. 3.1. Panel a: clear secondary and tertiary components, which are also apparent in the other panels. These additional components are made up of particles that were released early on in the formation of the stream.
Current usage metrics show cumulative count of Article Views (full-text article views including HTML views, PDF and ePub downloads, according to the available data) and Abstracts Views on Vision4Press platform.
Data correspond to usage on the plateform after 2015. The current usage metrics is available 48-96 hours after online publication and is updated daily on week days.
Initial download of the metrics may take a while.