Fig. 5
Download original image
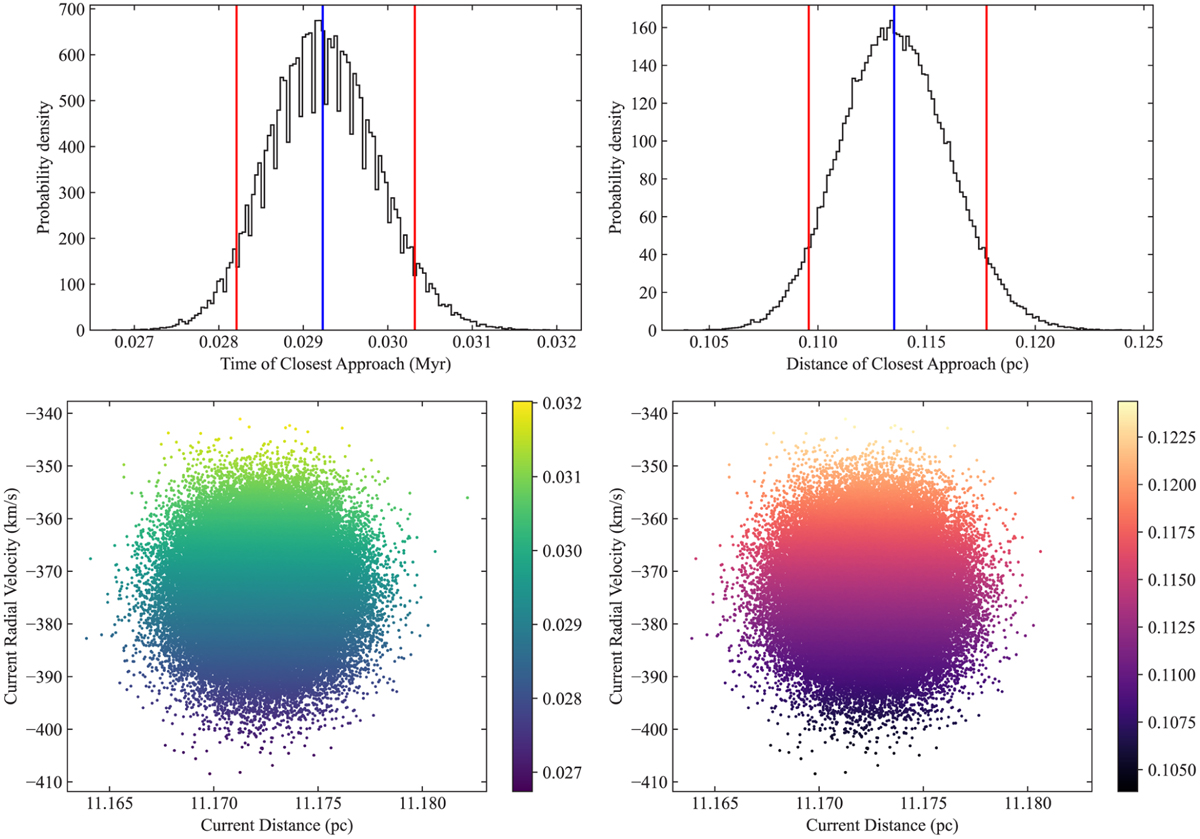
Future perihelion passage of WD 0810-353 as estimated from Gaia DR3 input data and the N-body simulations discussed in the text without accounting for the effect of Einstein’s gravitational redshift. The distribution of times of perihelion passage is shown in the top-left panel and perihelion distances in the top-right one. The blue vertical lines mark the median values, and the red ones show the 5th and 95th percentiles. The bottom panels show the times of perihelion passage in megayears (bottom left) and the distance of closest approach in parsecs (bottom right) as a function of the observed values of the radial velocity of WD 0810-353 and its distance (randomly generated using the mean values and standard deviations from Gaia DR3), both as color-coded scatter plots of the distribution in the associated top panel. Histograms were produced using the Matplotlib library (Hunter 2007) with sets of bins computed using Astropy (Astropy Collaboration 2013, 2018) by applying the Freedman and Diaconis rule (Freedman & Diaconis 1981); instead of considering frequency-based histograms, we used counts to form a probability density such that the area under the histogram sums to one. The color map scatter plot was also produced using Matplotlib.
Current usage metrics show cumulative count of Article Views (full-text article views including HTML views, PDF and ePub downloads, according to the available data) and Abstracts Views on Vision4Press platform.
Data correspond to usage on the plateform after 2015. The current usage metrics is available 48-96 hours after online publication and is updated daily on week days.
Initial download of the metrics may take a while.