Fig. 6.
Download original image
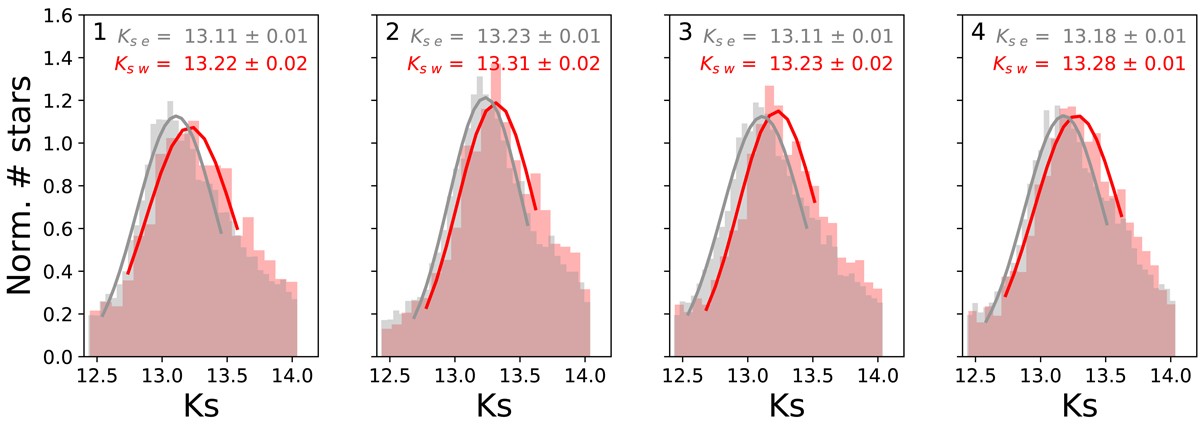
De-reddened RC Ks luminosity function for different NSD regions. The histograms, Gaussian fits, and numbers in each panel refer to the eastward-moving stellar population (in grey) and the westward-moving stars (in red). The numbers in each panel indicate the associated region in Fig. 1. The Ks e and Ks w values indicate the mean value of the Gaussian fits and its associated uncertainty for the eastward- and westward-moving stars.
Current usage metrics show cumulative count of Article Views (full-text article views including HTML views, PDF and ePub downloads, according to the available data) and Abstracts Views on Vision4Press platform.
Data correspond to usage on the plateform after 2015. The current usage metrics is available 48-96 hours after online publication and is updated daily on week days.
Initial download of the metrics may take a while.