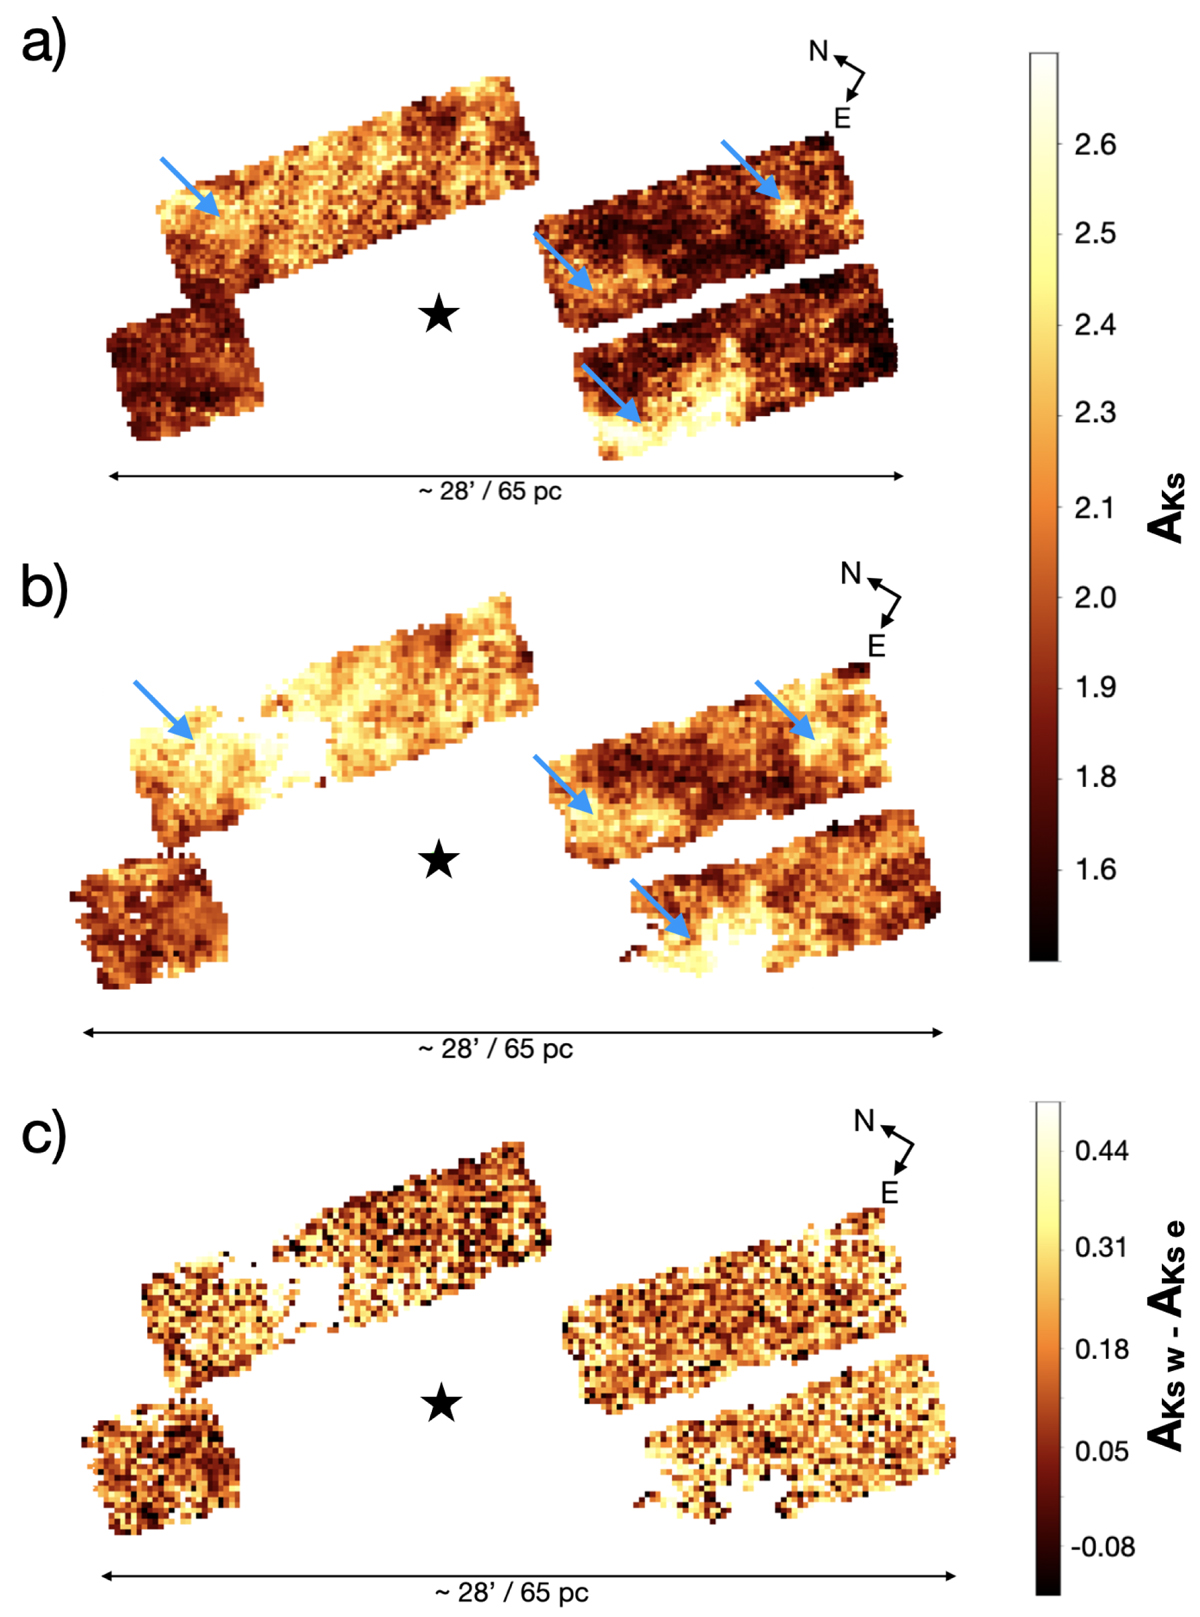
Fig. 5.
Download original image
Extinction maps towards the analysed regions (panels a and b, built using eastward- and westward-moving RC stars, respectively), and their difference (panel c). The black star indicates the position of Sagittarius A*. The blue arrows in panels a and b correspond to regions with similar extinction structures in both maps. The white pixels indicate that there is not any extinction value associated, due to the low number of reference stars.
Current usage metrics show cumulative count of Article Views (full-text article views including HTML views, PDF and ePub downloads, according to the available data) and Abstracts Views on Vision4Press platform.
Data correspond to usage on the plateform after 2015. The current usage metrics is available 48-96 hours after online publication and is updated daily on week days.
Initial download of the metrics may take a while.