Fig. 1.
Download original image
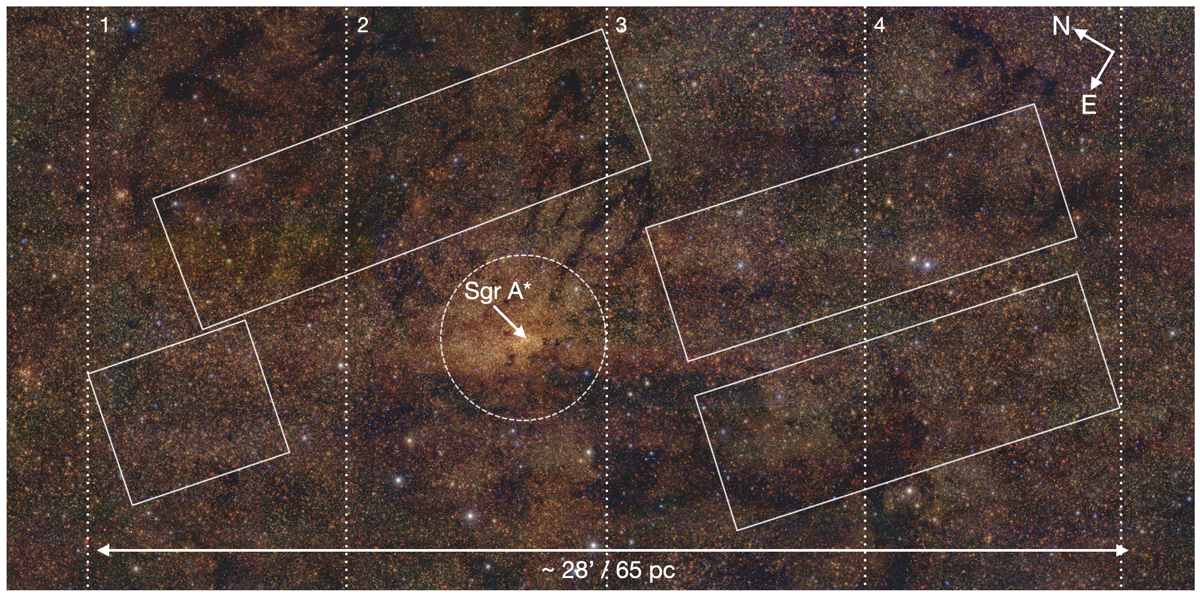
GALACTICNUCLEUS false colour image of the central region of the NSD. The white rectangles indicate the regions covered by the proper motion catalogue. The white dashed circle shows the effective radius of the nuclear star cluster (∼5 pc, e.g., Gallego-Cano et al. 2020) with Sagittarius A* at its centre. The white dashed lines indicate the four regions used for the distance and extinction analysis in Sect. 4.
Current usage metrics show cumulative count of Article Views (full-text article views including HTML views, PDF and ePub downloads, according to the available data) and Abstracts Views on Vision4Press platform.
Data correspond to usage on the plateform after 2015. The current usage metrics is available 48-96 hours after online publication and is updated daily on week days.
Initial download of the metrics may take a while.