Fig. 3
Download original image
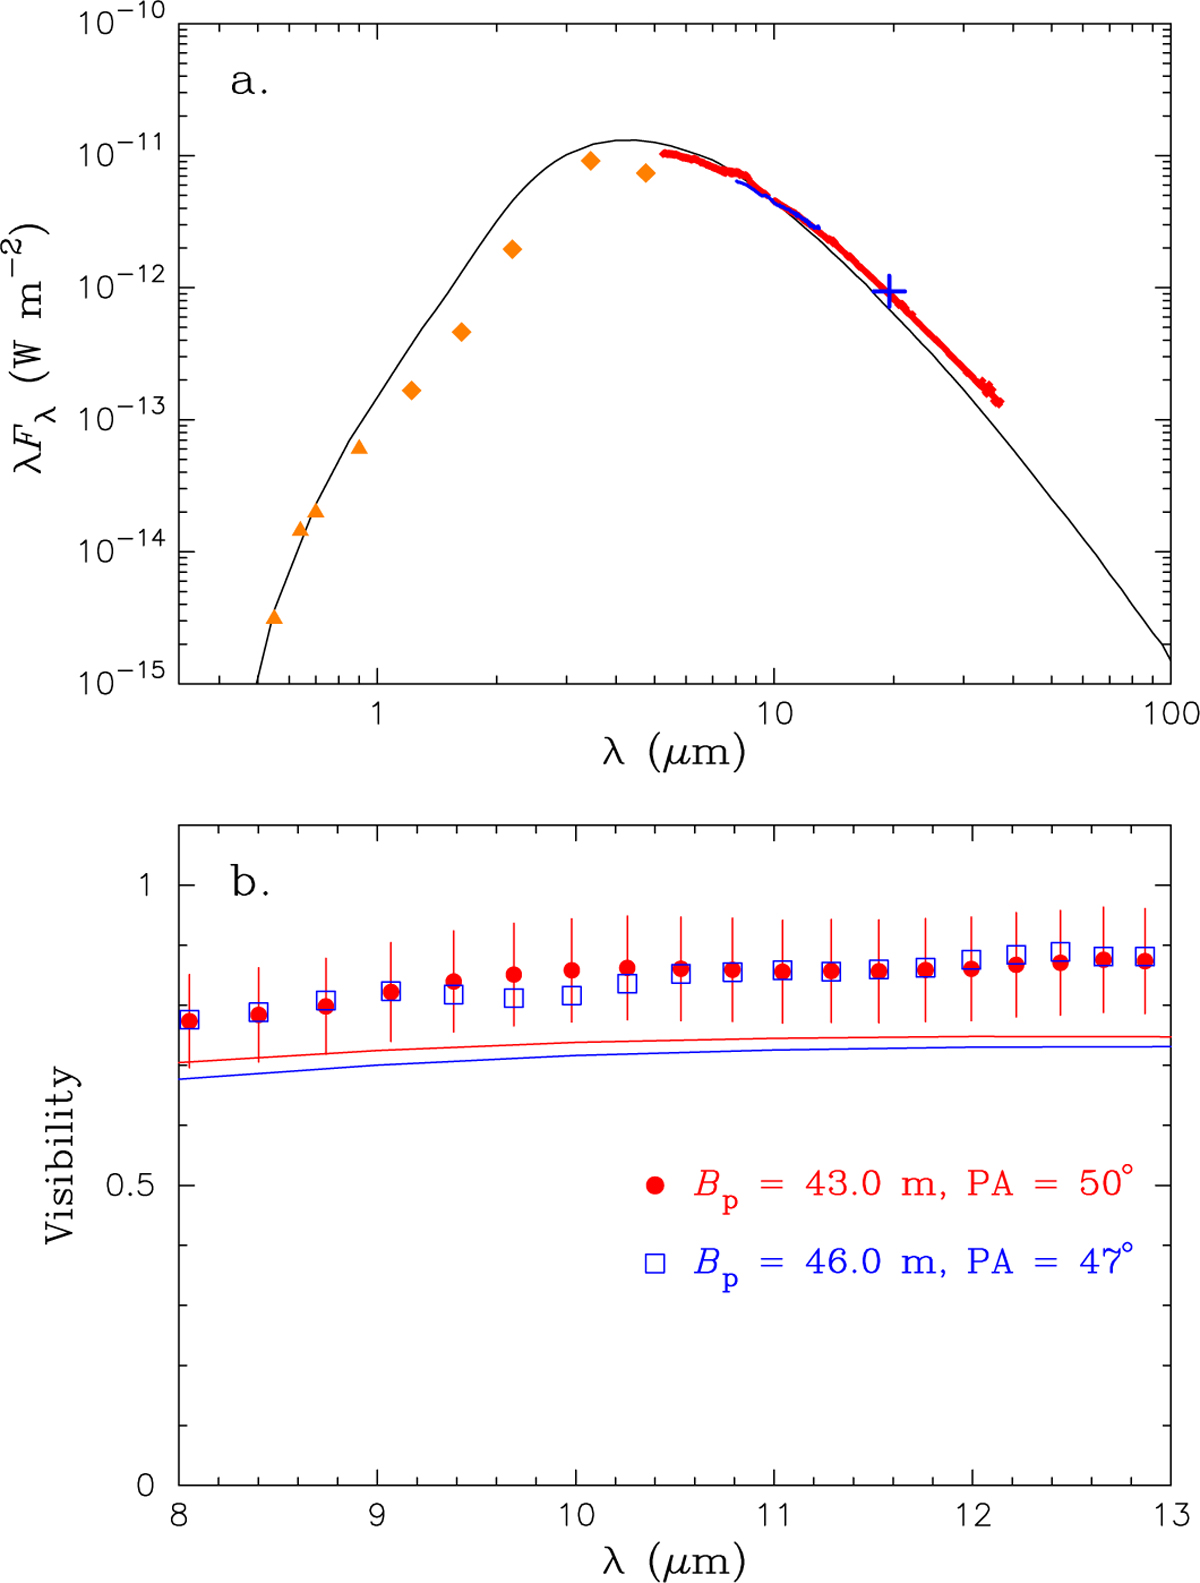
Comparison of a spherical shell model with the observed SED and N-band visibilities of FG Sge. The model is characterized with Tin = 1100 K, a piecewise power-law density profile with r−3.5 (rin ≤ r ≤ rtr with rin = 33 R★ and rtr = 5 rin) and r−2 (r > rtr), τV = 8, and Teff = 5000 K. a) Observed SED. Orange filled triangles correspond to visible photometric data from Arkhipova et al. (2009). Orange filled diamonds are the infrared photometric data from Shenavrin et al. (2011). The photometric data were dereddened with AV = 0.63. The thick solid red line is the Spitzer/IRS spectrum. The thin solid blue line corresponds to the MIDI spectrum. The blue cross corresponds to VISIR photometry. The DUSTY model is shown with the solid black line. b) Observed visibilities are shown in the same manner as in Fig. 1a. The solid red and blue lines represent the model visibilities predicted for the 43.0 and 46.0 m baselines, respectively.
Current usage metrics show cumulative count of Article Views (full-text article views including HTML views, PDF and ePub downloads, according to the available data) and Abstracts Views on Vision4Press platform.
Data correspond to usage on the plateform after 2015. The current usage metrics is available 48-96 hours after online publication and is updated daily on week days.
Initial download of the metrics may take a while.