Open Access
Fig. 1
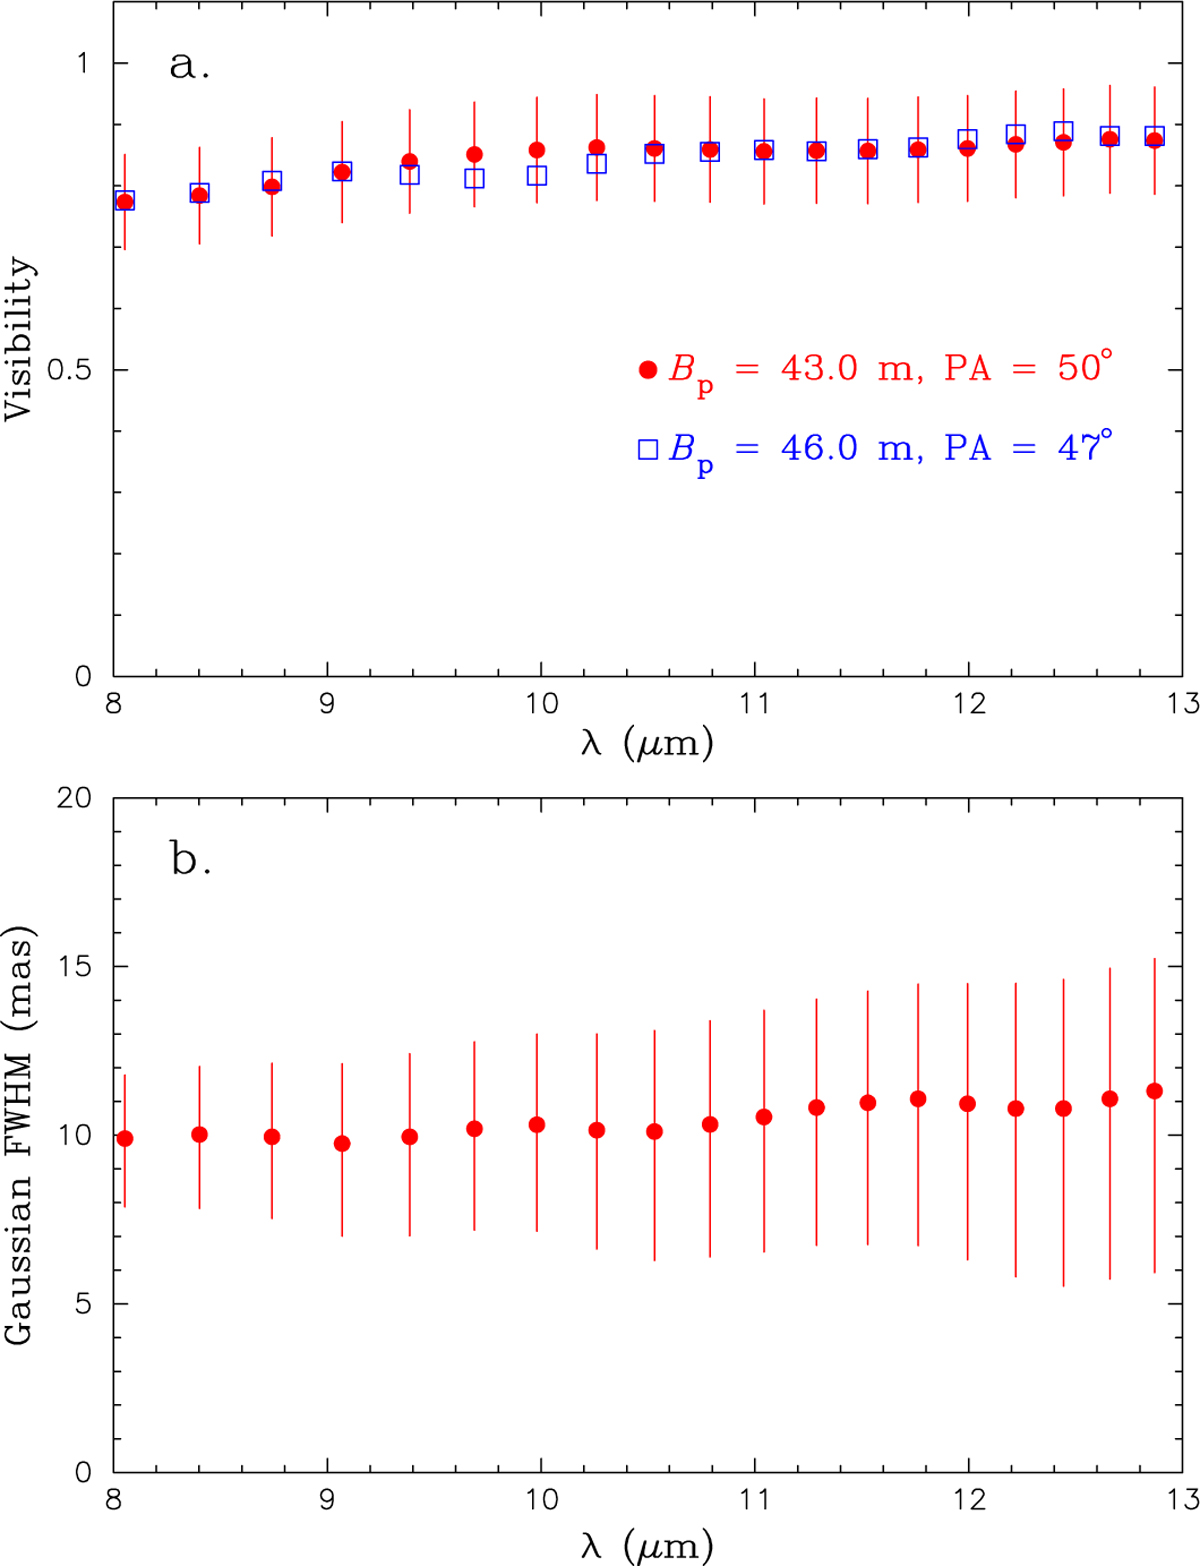
Download original image
VLTI/MIDI observations of FG Sge. a) Observed visibilities of the data set SCI1 (red dots) and the average of SCI2 and SCI3 (blue dots). The error bars are only shown for the data set SCI1 for visual clarity. b) FWHM obtained by a Gaussian fit to the observed visibilities.
Current usage metrics show cumulative count of Article Views (full-text article views including HTML views, PDF and ePub downloads, according to the available data) and Abstracts Views on Vision4Press platform.
Data correspond to usage on the plateform after 2015. The current usage metrics is available 48-96 hours after online publication and is updated daily on week days.
Initial download of the metrics may take a while.