Fig. 4
Download original image
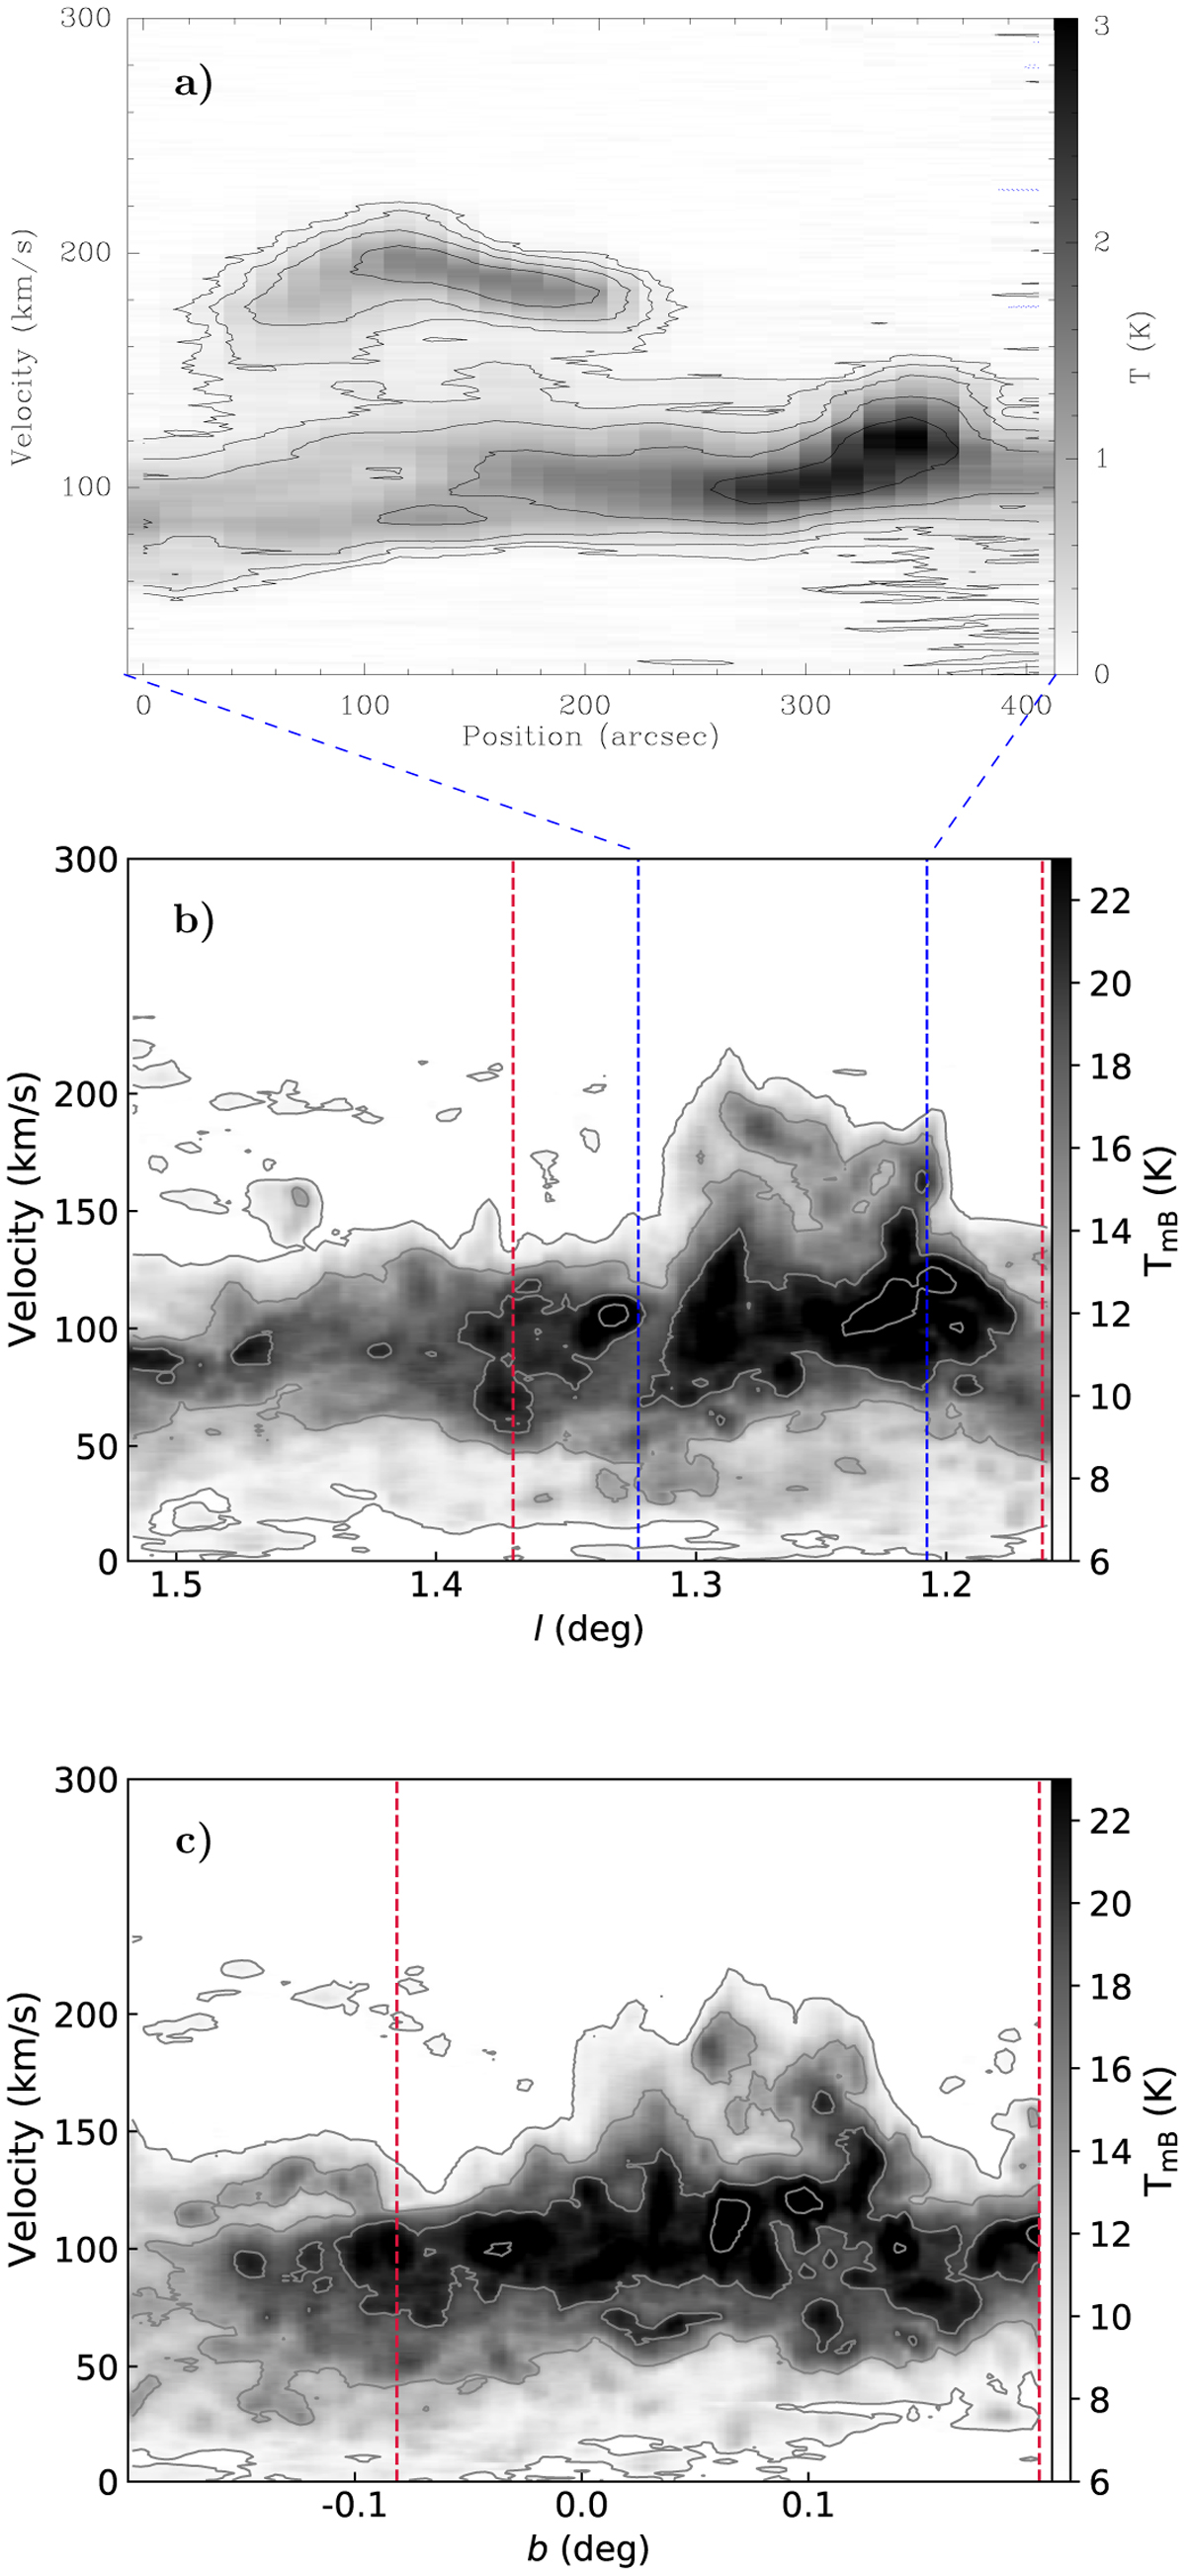
Velocity distribution of molecular line emission in the G1.3 region. Panel a: PV diagram of CS 2–1 emission along the black arrow labelled Dl in Fig. 3. The position axis originates from the start of the arrow and is completely covered by the length of it. The contour levels are −4σ, 4σ, 8σ, 16σ, 32σ, and 64σ with σ = 0.03 K. Panel b: longitude-velocity diagram of CO 2–1 data, where we show the maximum intensity along the latitude axis per pixel. The contour steps start at 20σ and then increase by the same value, with σ = 0.33 K. Blue dashed lines indicate the position axis covered in (a). Panel c: same as (b), but it shows latitude versus velocity and the maximum intensity along the longitude axis per pixel. Dashed red lines in (b) and (c) indicate the complete longitude and latitude ranges observed in this work with the IRAM 30 m telescope, respectively.
Current usage metrics show cumulative count of Article Views (full-text article views including HTML views, PDF and ePub downloads, according to the available data) and Abstracts Views on Vision4Press platform.
Data correspond to usage on the plateform after 2015. The current usage metrics is available 48-96 hours after online publication and is updated daily on week days.
Initial download of the metrics may take a while.