Fig. 3
Download original image
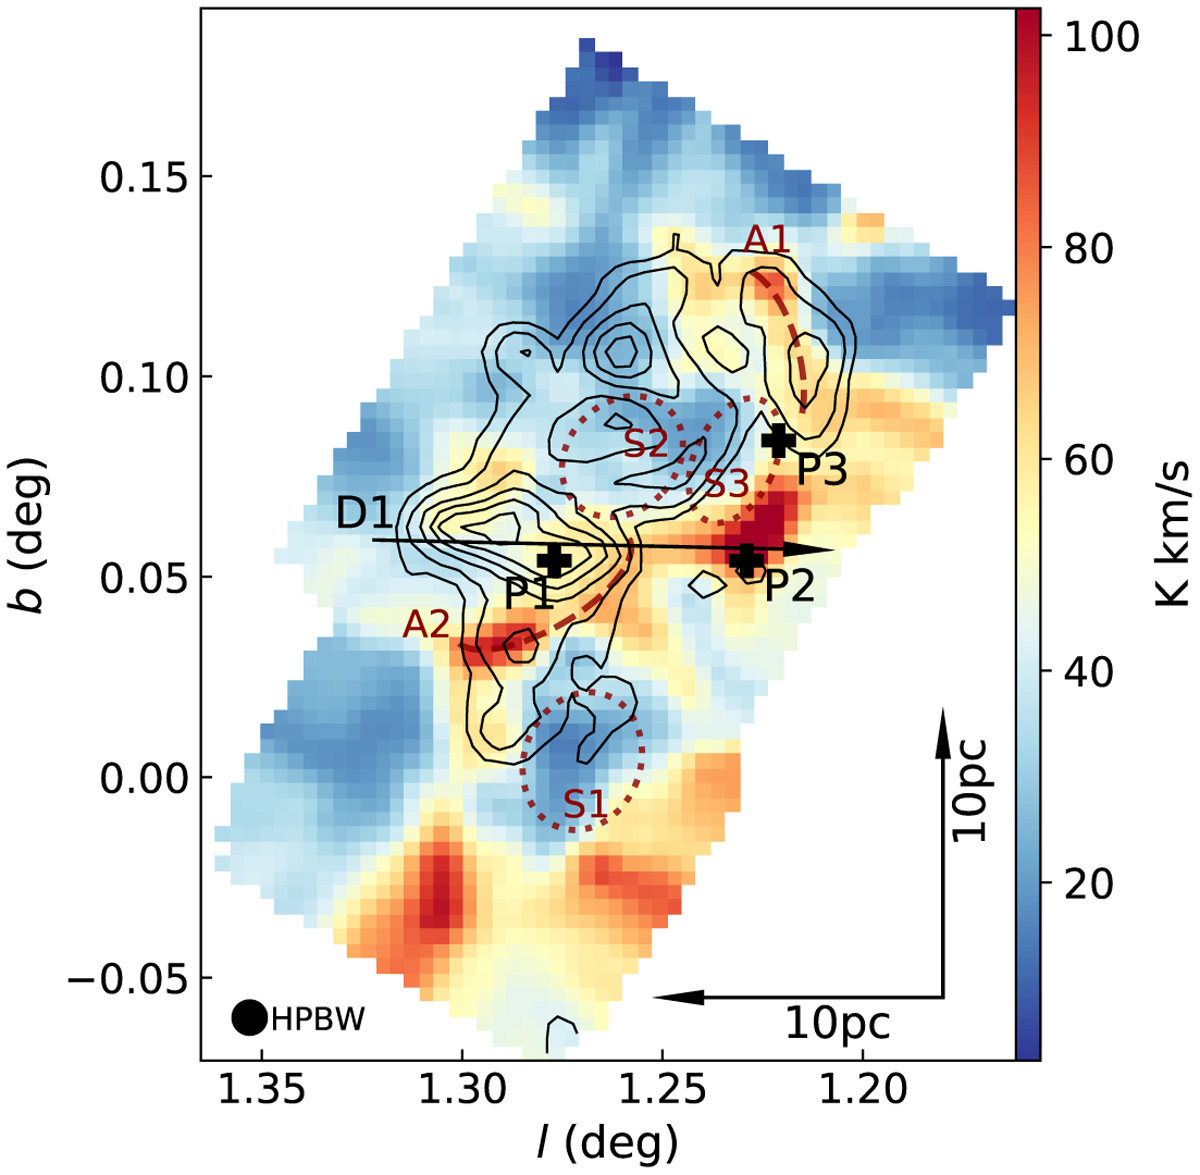
CS 2–1 intensities towards G1.3 integrated from 35 to 150 km s−1 (low- and intermediate-velocity components) are shown in colour-scale and from 150 to 220 km s−1 (high-velocity component) are shown with black contours. Contour levels are 6σ, 12σ, and then increase by 12σ with σ = 1.0 K km s−1. The HPBW is shown in the bottom left corner. The black arrow labelled D1 indicates the position axis along which the PV diagram in Fig. 4a was taken. Black crosses labelled P1–P3 indicate positions selected for further analysis. Dark red ellipses labelled S1–S3 correspond to shells A, C, and C1, respectively, identified by Tanaka et al. (2007). Arcs Al and A2 indicate regions of seemingly spatial coincidences of the low- and high-velocity gas (see text).
Current usage metrics show cumulative count of Article Views (full-text article views including HTML views, PDF and ePub downloads, according to the available data) and Abstracts Views on Vision4Press platform.
Data correspond to usage on the plateform after 2015. The current usage metrics is available 48-96 hours after online publication and is updated daily on week days.
Initial download of the metrics may take a while.