Fig. 2
Download original image
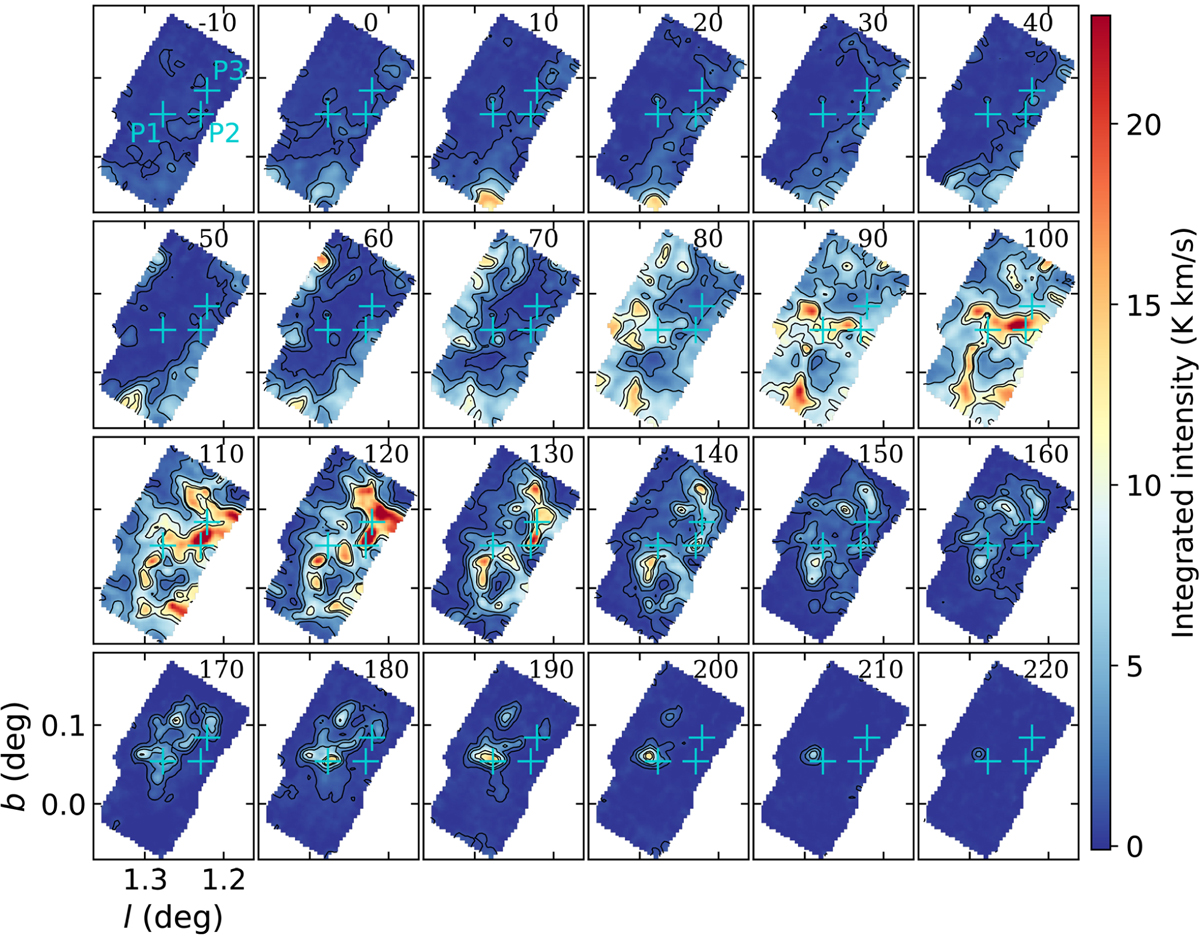
Velocity-channel maps of CS 2–1 emission towards G1.3. Intensities are integrated in velocity steps of 10 km s−1. The central velocity is displayed in km s−1 in the upper right corner in each map. The contour steps are 3σ, 9σ, 18σ, 36σ, and 45σ with σ = 0.25 K km s−1. Blue crosses labelled P1–P3 indicate positions selected for further analysis.
Current usage metrics show cumulative count of Article Views (full-text article views including HTML views, PDF and ePub downloads, according to the available data) and Abstracts Views on Vision4Press platform.
Data correspond to usage on the plateform after 2015. The current usage metrics is available 48-96 hours after online publication and is updated daily on week days.
Initial download of the metrics may take a while.