Fig. B.2
Download original image
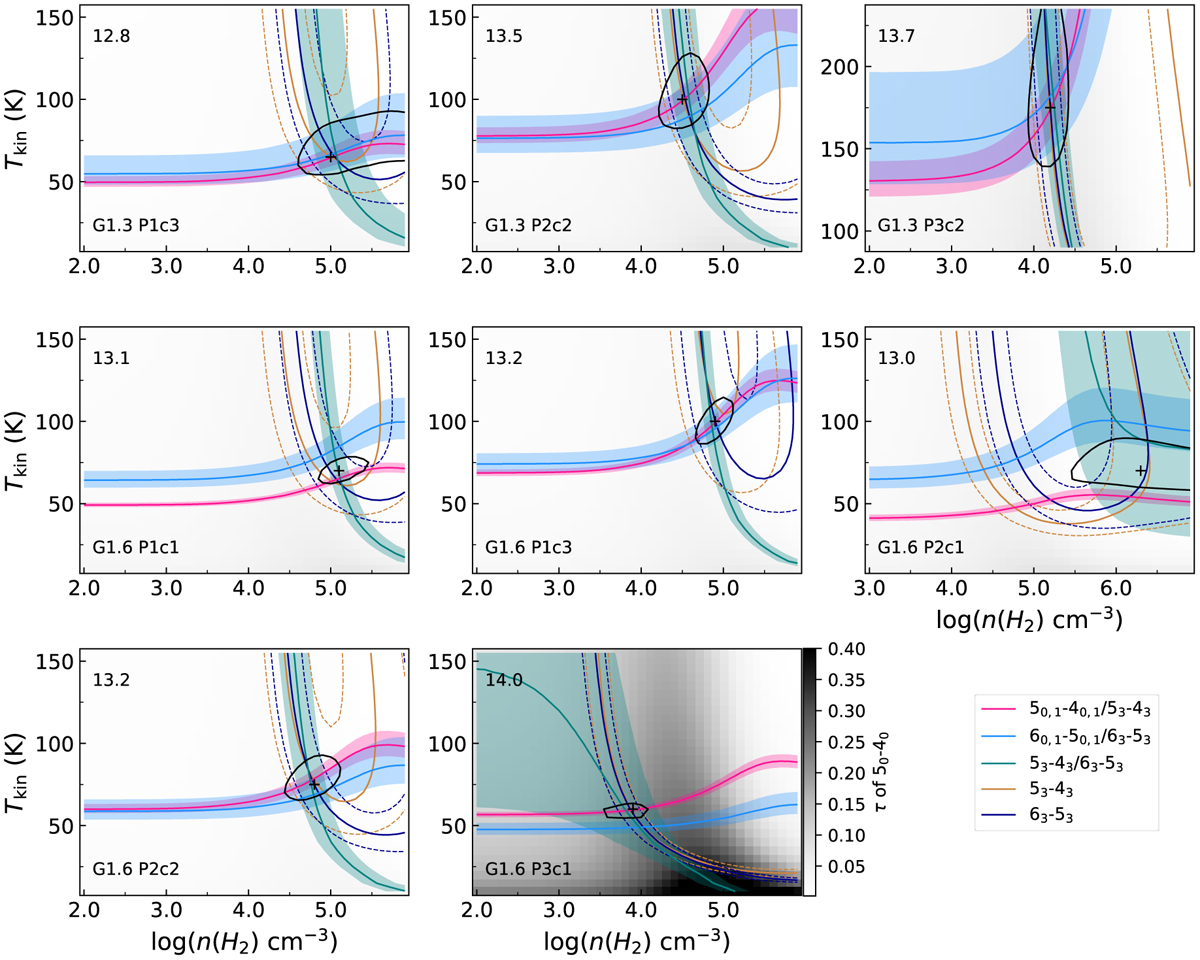
RADEX results for CH3CN. Yellow and dark blue contours show where observed and modelled integrated intensities match, while teal, light blue and pink contours show the same but using ratios of integrated intensity. Dashed contours and shaded areas represent uncertainties, respectively. The grey scale shows the opacity of the 50–40 transition in all panels. The K = 0 and K = 1 lines cannot be separated due to blending and were, therefore, considered as one component. The black cross shows the most probable result for Tkin and n(H2) determined by minimising χ2 that is, where ![]() . The closed black contours indicate a confidence level of 95.45%. The respective source and velocity component are shown in the lower left, the best-fit decimal power of column density (in cm−2) in the upper left corner.
. The closed black contours indicate a confidence level of 95.45%. The respective source and velocity component are shown in the lower left, the best-fit decimal power of column density (in cm−2) in the upper left corner.
Current usage metrics show cumulative count of Article Views (full-text article views including HTML views, PDF and ePub downloads, according to the available data) and Abstracts Views on Vision4Press platform.
Data correspond to usage on the plateform after 2015. The current usage metrics is available 48-96 hours after online publication and is updated daily on week days.
Initial download of the metrics may take a while.