Open Access
Fig. B.1
Download original image
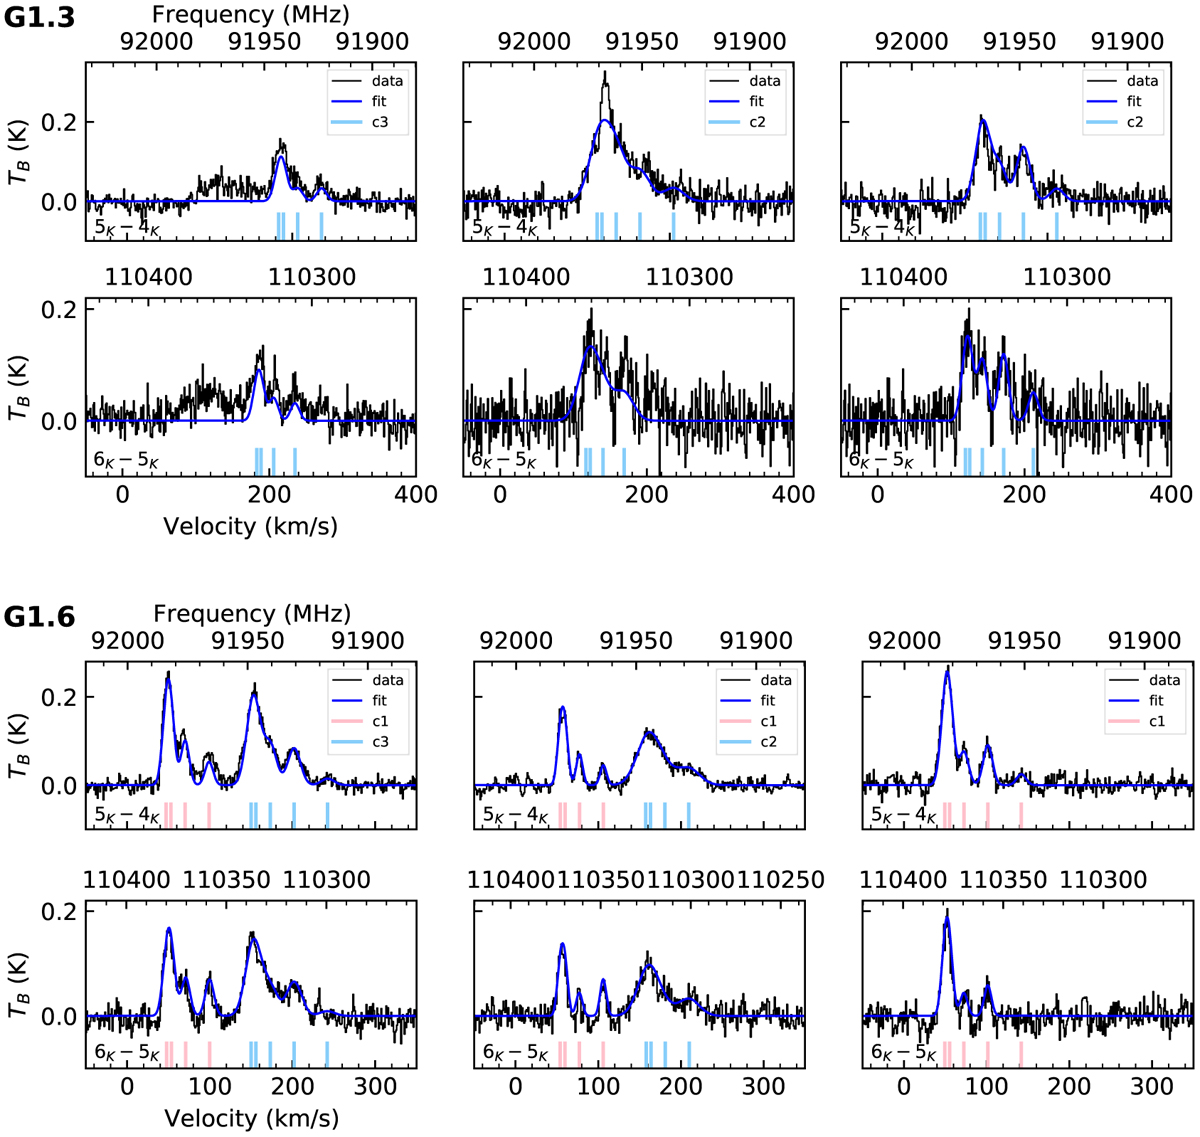
CH3CN 5K–4K and 6K–5K spectra at positions P1 to P3 (left to right) in G1.3 (top) and G1.6 (bottom), respectively. The blue curve shows the 1D Gaussian fit. Rest frequencies of all K transitions for each fitted velocity component ci with i = (1, 2) are indicated with vertical lines at the bottom.
Current usage metrics show cumulative count of Article Views (full-text article views including HTML views, PDF and ePub downloads, according to the available data) and Abstracts Views on Vision4Press platform.
Data correspond to usage on the plateform after 2015. The current usage metrics is available 48-96 hours after online publication and is updated daily on week days.
Initial download of the metrics may take a while.