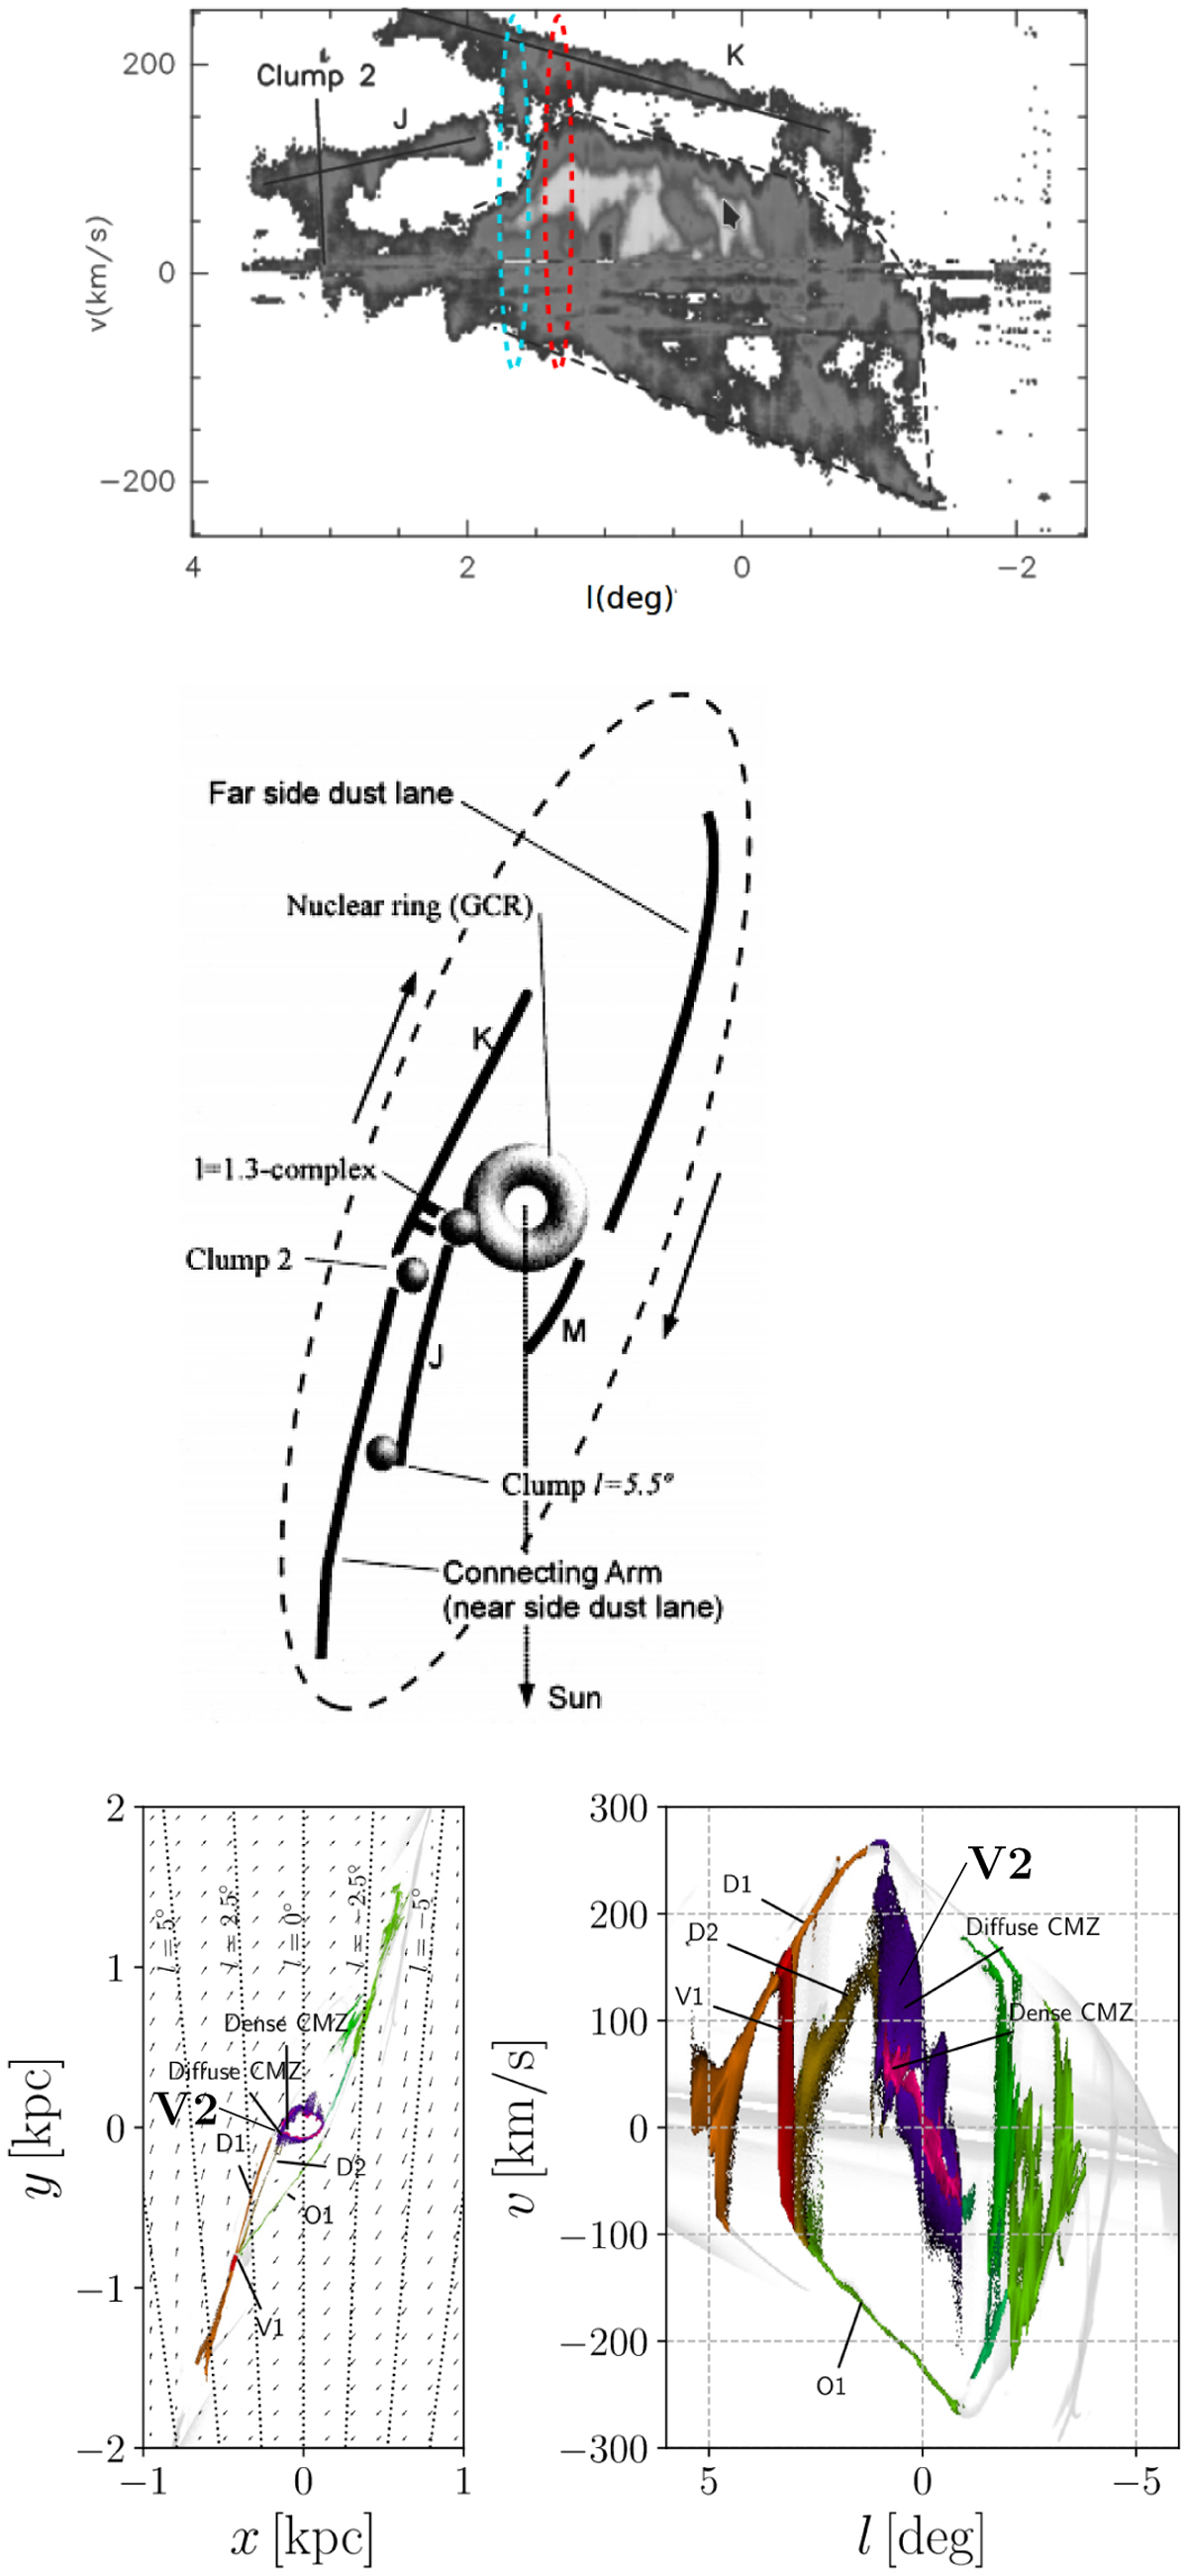
Fig. 12
Download original image
Cloud complexes G1.3 and G1.6 and other sources in the picture of the GC region. Top panel: longitude-velocity diagram of CO 1–0 emission in the GC region (taken from Rodríguez-Fernández & Combes 2008) using data of Bally et al. (1987). Intensities were integrated over all negative Galactic latitudes. Solid lines indicate features such as Clump2 and dust lanes K and J (Rodríguez-Fernández et al. 2006). Middle panel: illustration of a possible face-on view of the GC region (taken from Rodríguez-Fernández et al. 2006). Bottom panels: recent simulations of the gas kinematics in the GC region by Sormani et al. (2019).
Current usage metrics show cumulative count of Article Views (full-text article views including HTML views, PDF and ePub downloads, according to the available data) and Abstracts Views on Vision4Press platform.
Data correspond to usage on the plateform after 2015. The current usage metrics is available 48-96 hours after online publication and is updated daily on week days.
Initial download of the metrics may take a while.