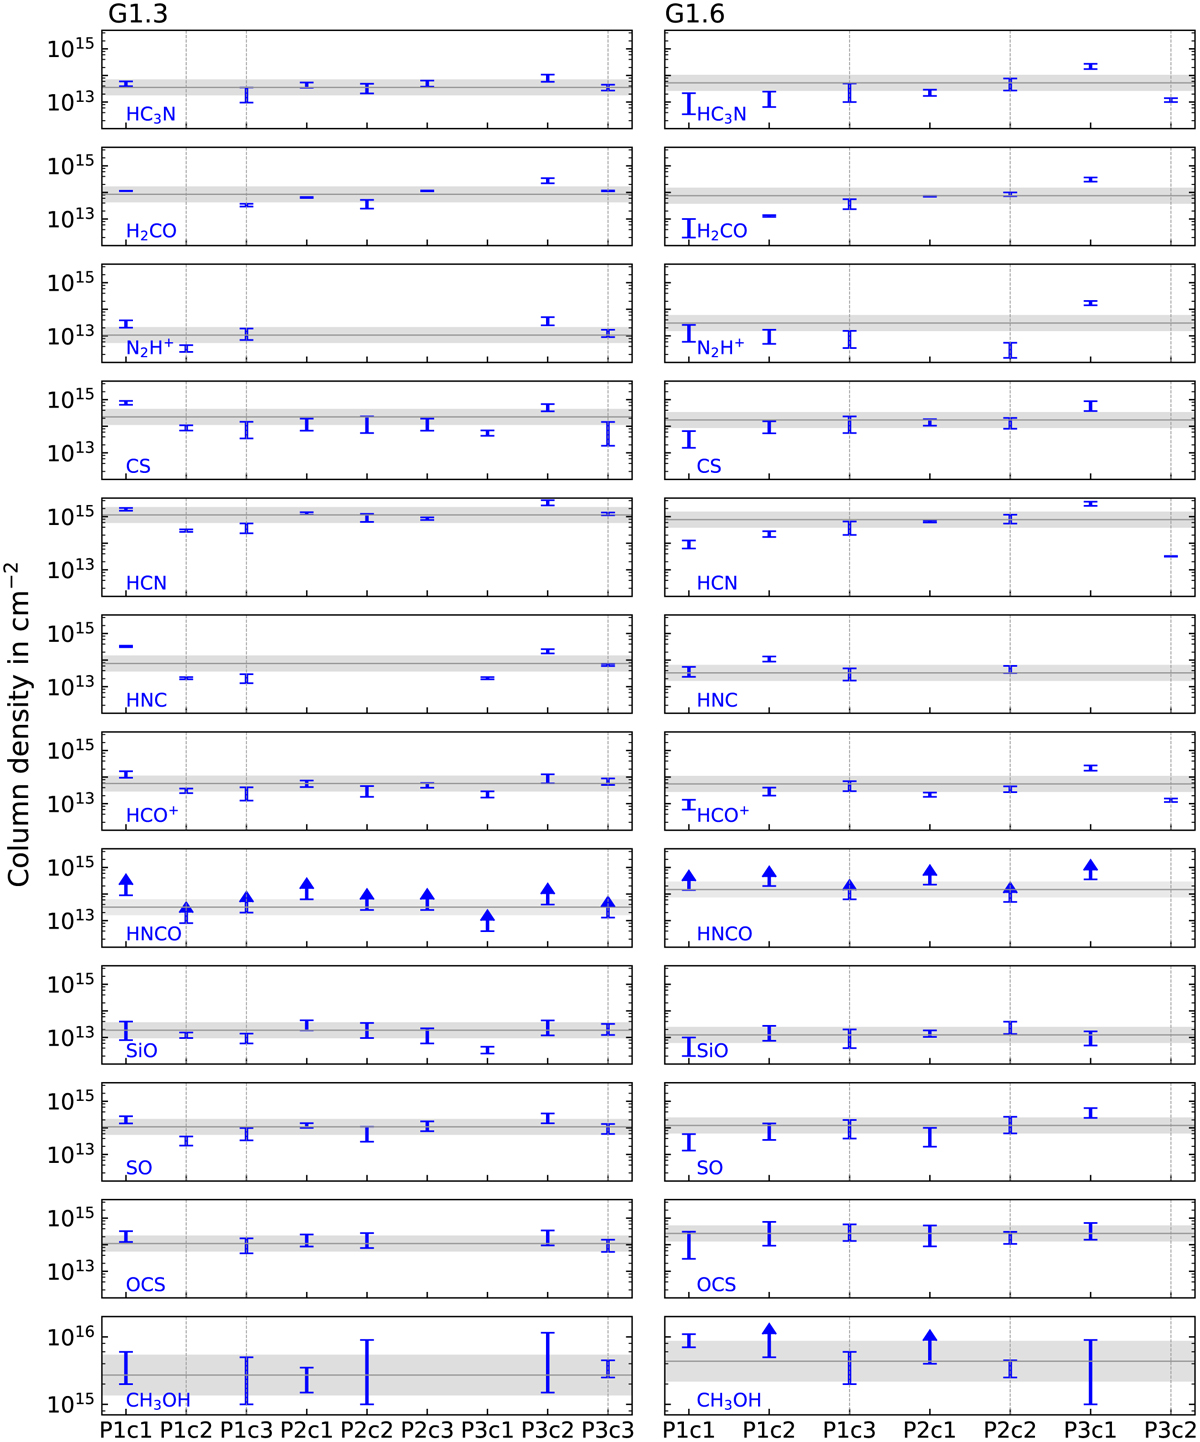
Fig. 10
Download original image
Column densities in all components of G1.3 (left panel) and G1.6 (right panel) obtained from non-LTE modelling with RADEX. The horizontal line shows the average column density in the cloud complex, the shaded area indicates a deviation from the average by a factor 2. Vertical dashed lines indicate the high-velocity components. Arrows indicate lower limits. If no marker is shown, either the molecule is not detected in this component or the molecule has not been modelled for various reasons (see Tables C.1, C.2 and text).
Current usage metrics show cumulative count of Article Views (full-text article views including HTML views, PDF and ePub downloads, according to the available data) and Abstracts Views on Vision4Press platform.
Data correspond to usage on the plateform after 2015. The current usage metrics is available 48-96 hours after online publication and is updated daily on week days.
Initial download of the metrics may take a while.