Fig. 1
Download original image
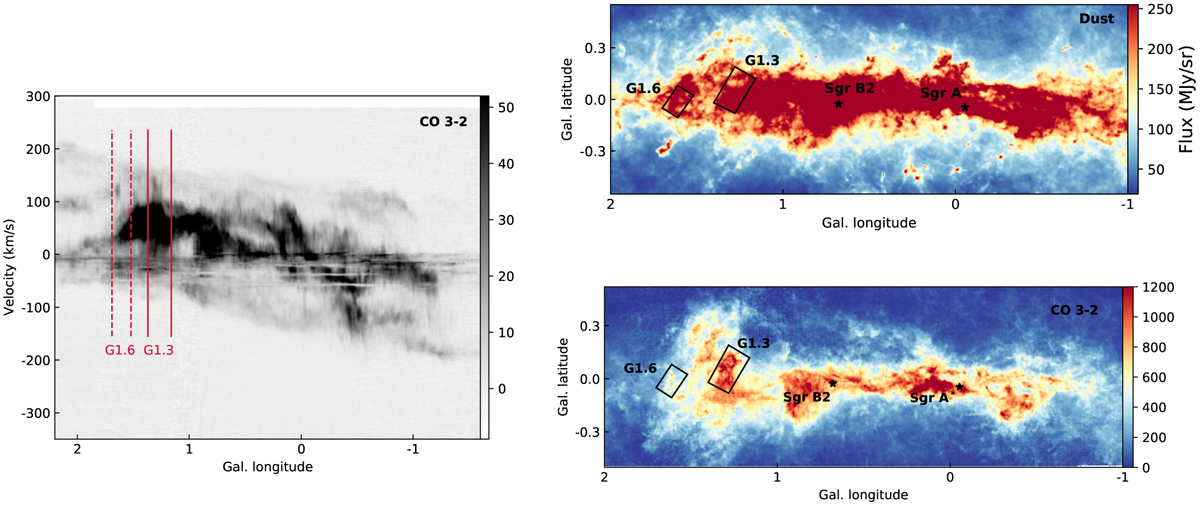
The Galactic centre region observed in molecular line and dust emissions. Left panel: CHIMPS 2 longitude-velocity diagram of 12CO 3–2 intensity integrated over |b| < 0.5° Galactic latitude (Eden et al. 2020). Solid and dashed red lines indicate the observed longitude range for G1.3 and G1.6, respectively. Right panels: Longitude-latitude maps of the CMZ observed in warm dust emission with Hi-Gal/Herschel (top, Molinari et al. 2016) and in 12CO 3–2 emission observed as part of the CHIMPS 2 survey (bottom, Eden et al. 2020). The regions of G1.3 and G1.6 that were covered during our IRAM 30m observations are indicated in black.
Current usage metrics show cumulative count of Article Views (full-text article views including HTML views, PDF and ePub downloads, according to the available data) and Abstracts Views on Vision4Press platform.
Data correspond to usage on the plateform after 2015. The current usage metrics is available 48-96 hours after online publication and is updated daily on week days.
Initial download of the metrics may take a while.