Fig. 3.
Download original image
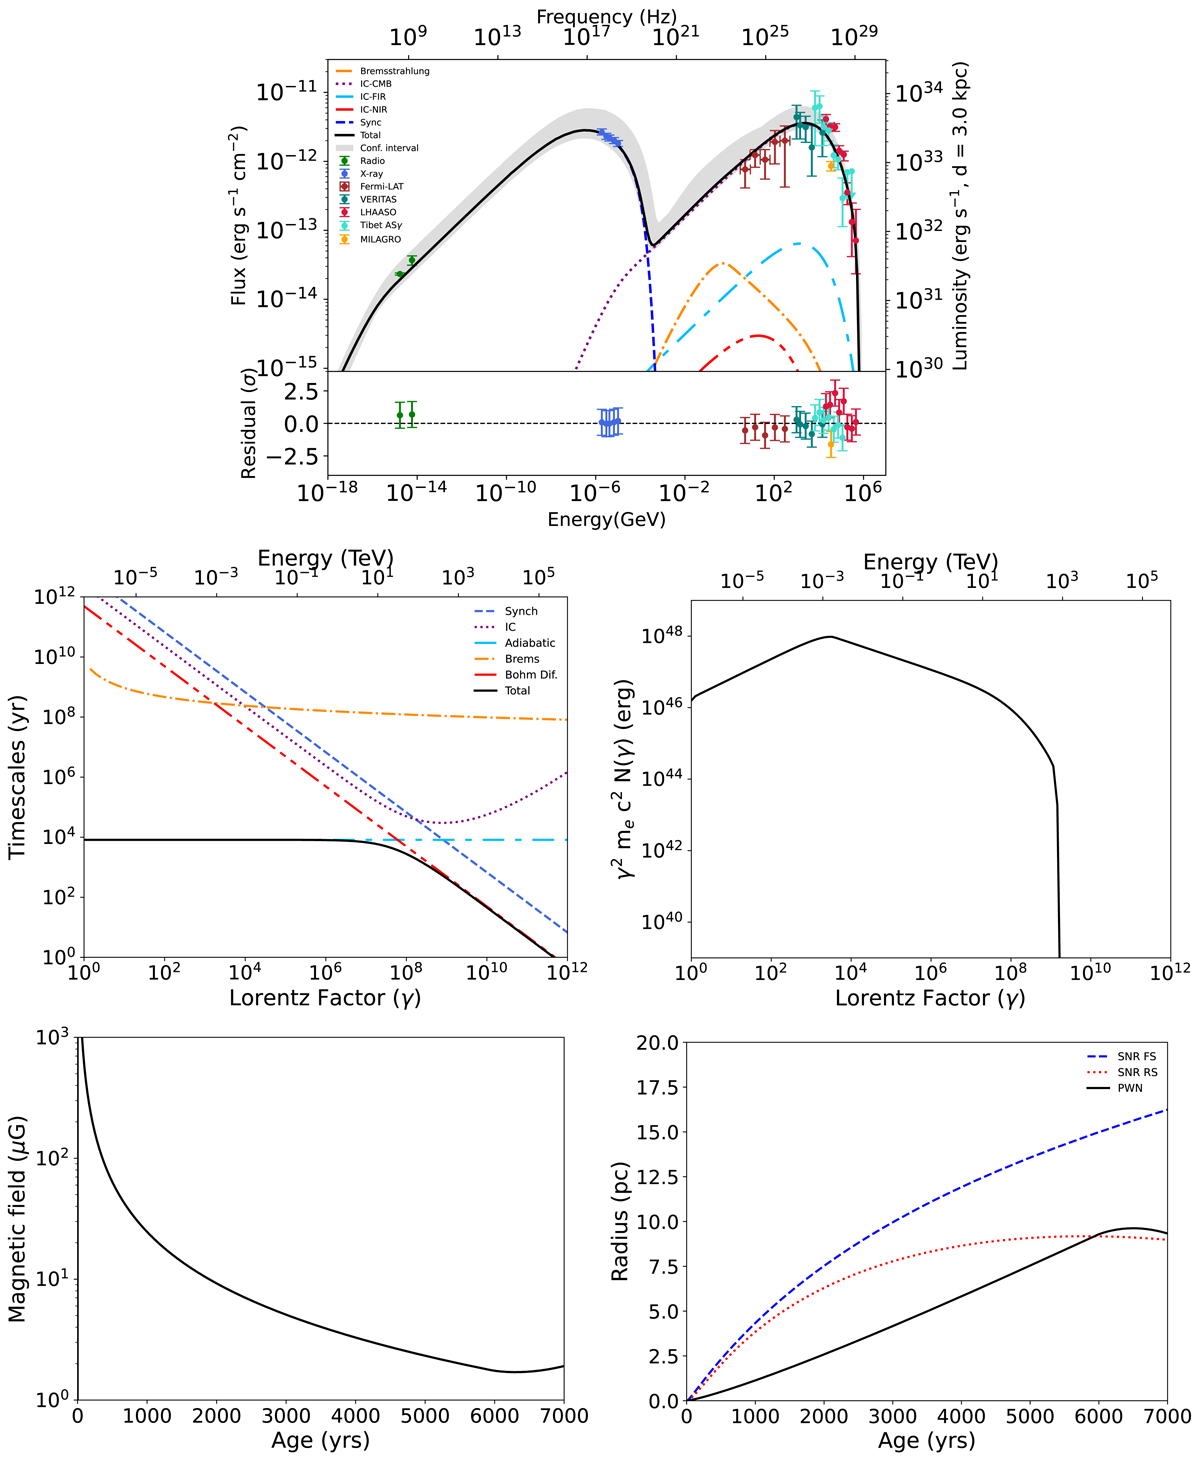
Calculated best-fit MWL spectrum is shown at the top row, along with the MWL data points. The color scheme of the data points are the same as that in Fig. 1. In the bottom panel of the figure, the residuals are also plotted. The color scheme of the residuals are the same as the data points. The middle row shows the timescales of radiative losses, adiabatic losses, and the escape of particles considered in the model (left) and the injected lepton spectrum at the present age (right). Also the time evolution of the magnetic field (left), as well as the SNR forward shock, SNR reverse shock, and PWN radius (right) are given in the bottom row.
Current usage metrics show cumulative count of Article Views (full-text article views including HTML views, PDF and ePub downloads, according to the available data) and Abstracts Views on Vision4Press platform.
Data correspond to usage on the plateform after 2015. The current usage metrics is available 48-96 hours after online publication and is updated daily on week days.
Initial download of the metrics may take a while.