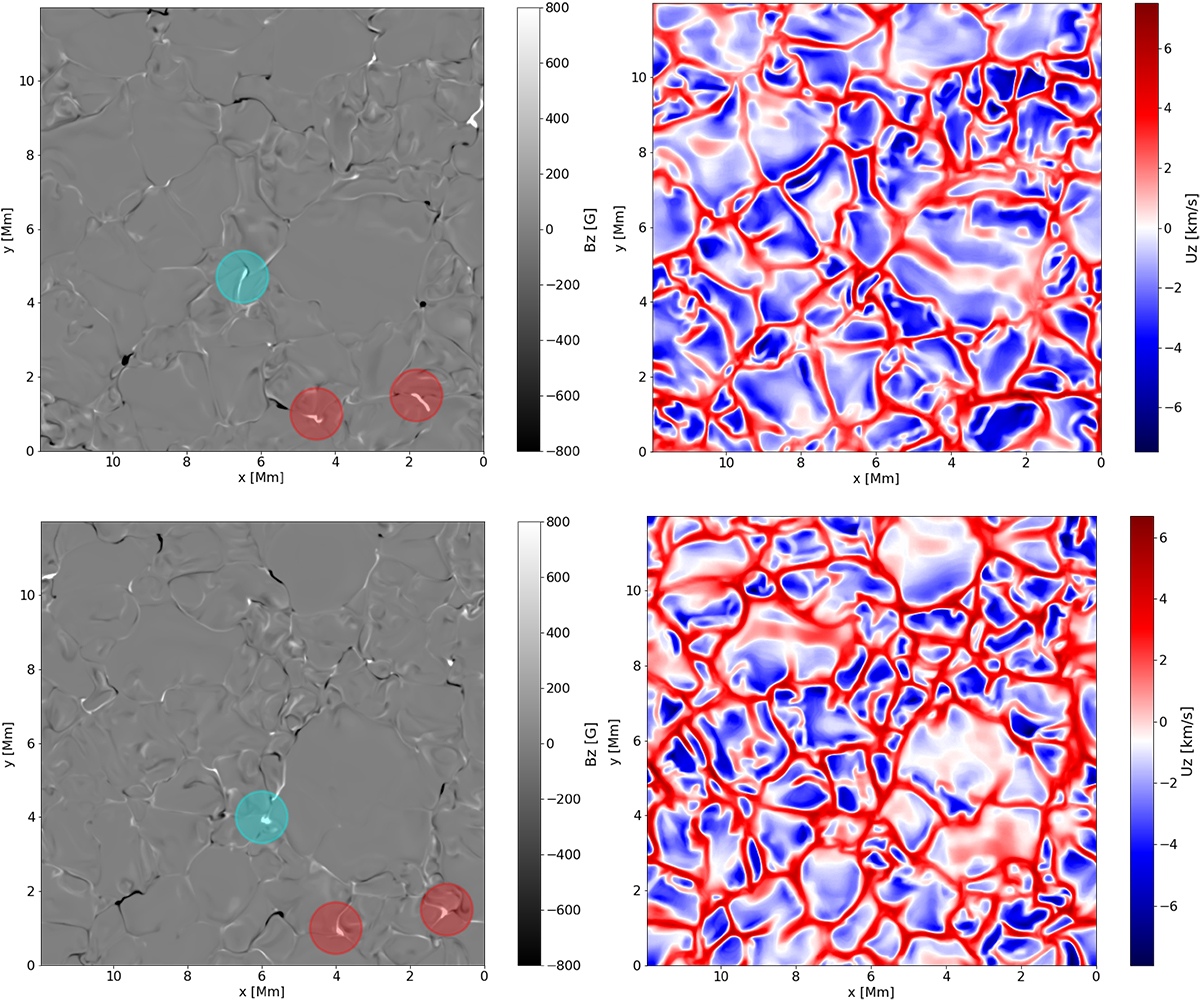
Fig. 8.
Download original image
Photospheric magnetogram Bz (left) and surface velocity uz (right) for t = 10 840 s, before the flux rope and arcade are ordered, shown at the top. Photospheric magnetogram Bz (left) and surface velocity uz (right) for t = 11 440 s, after the main reconnection event, shown at the bottom. Cyan circles on the magnetograms represent the main positive photospheric root for the arcade, and red circles represent the main positive photospheric roots for the flux rope. The difference in time between the top and bottom panels is 600 s, accounting for roughly one photospheric turnover time.
Current usage metrics show cumulative count of Article Views (full-text article views including HTML views, PDF and ePub downloads, according to the available data) and Abstracts Views on Vision4Press platform.
Data correspond to usage on the plateform after 2015. The current usage metrics is available 48-96 hours after online publication and is updated daily on week days.
Initial download of the metrics may take a while.