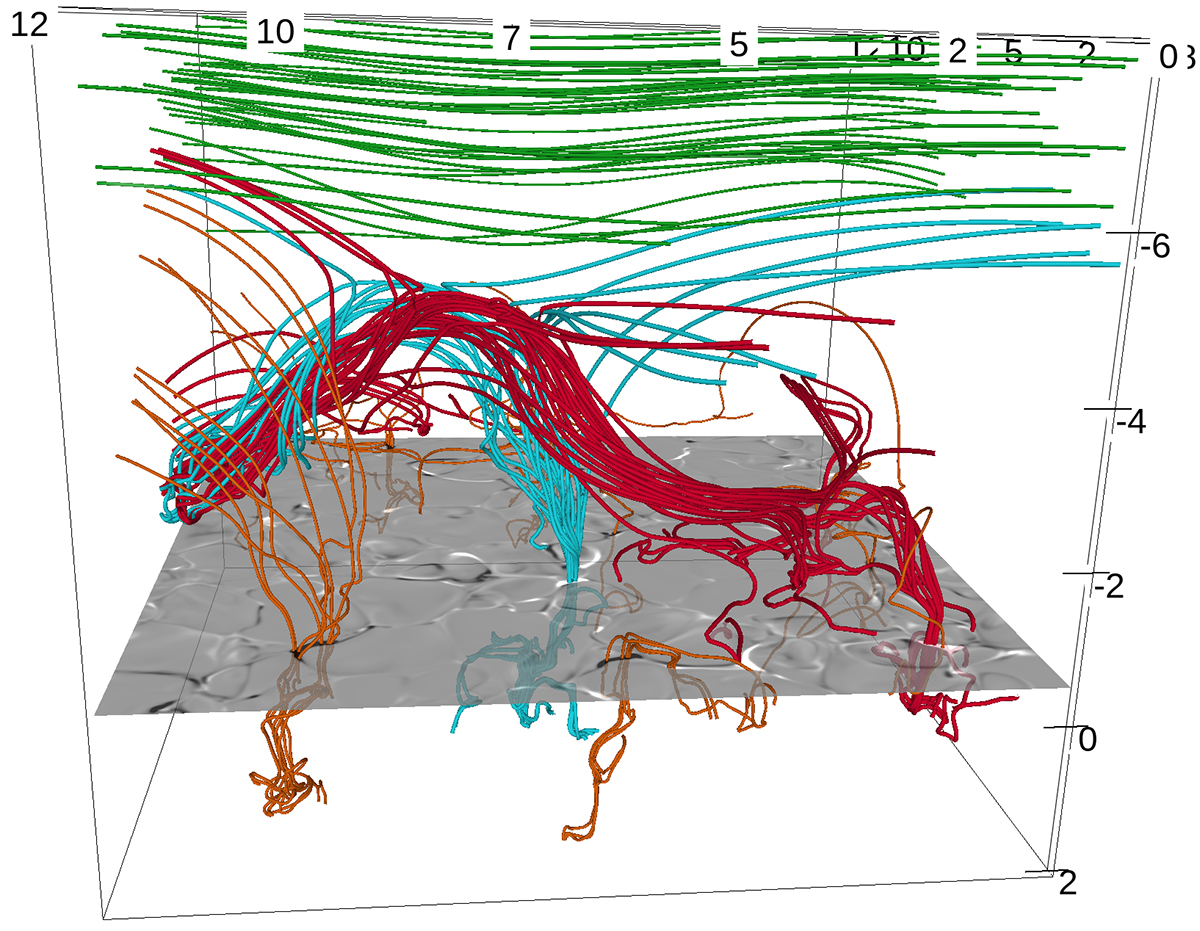
Fig. 6.
Download original image
Visualization of field lines at t = 11 360 s with the photospheric Bz field and the overlying magnetic field seeded four different ways. The green field represents the overlying horizontal coronal field, the red and cyan fields are seeded by corks near regions with high current density and ȷ/B, and the orange field is seeded with a bias toward the photospheric −Bz field. The overlying horizontal field (green) is nearly anti-parallel to the red and cyan features.
Current usage metrics show cumulative count of Article Views (full-text article views including HTML views, PDF and ePub downloads, according to the available data) and Abstracts Views on Vision4Press platform.
Data correspond to usage on the plateform after 2015. The current usage metrics is available 48-96 hours after online publication and is updated daily on week days.
Initial download of the metrics may take a while.