Fig. 5.
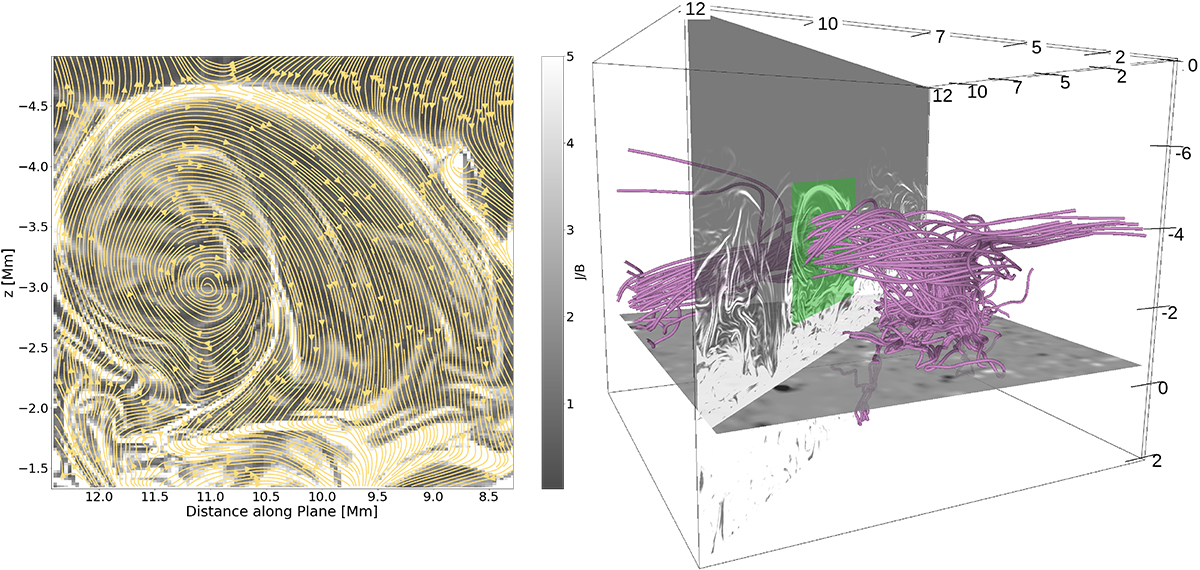
Download original image
Orthogonal slice through the flux rope (shown in the bottom-left panel of Fig. 4) to illustrate the twist of the field (yellow arrows) as well as ȷ/B values in the background at t = 11 240 s, before the main reconnection event (left). Full extent of the simulation box including a more comprehensive picture of the flux rope, with the orthogonal slice of ȷ/B values to indicate where the cut was taken (right). The green rectangle indicates the field of view of the left panel.
Current usage metrics show cumulative count of Article Views (full-text article views including HTML views, PDF and ePub downloads, according to the available data) and Abstracts Views on Vision4Press platform.
Data correspond to usage on the plateform after 2015. The current usage metrics is available 48-96 hours after online publication and is updated daily on week days.
Initial download of the metrics may take a while.