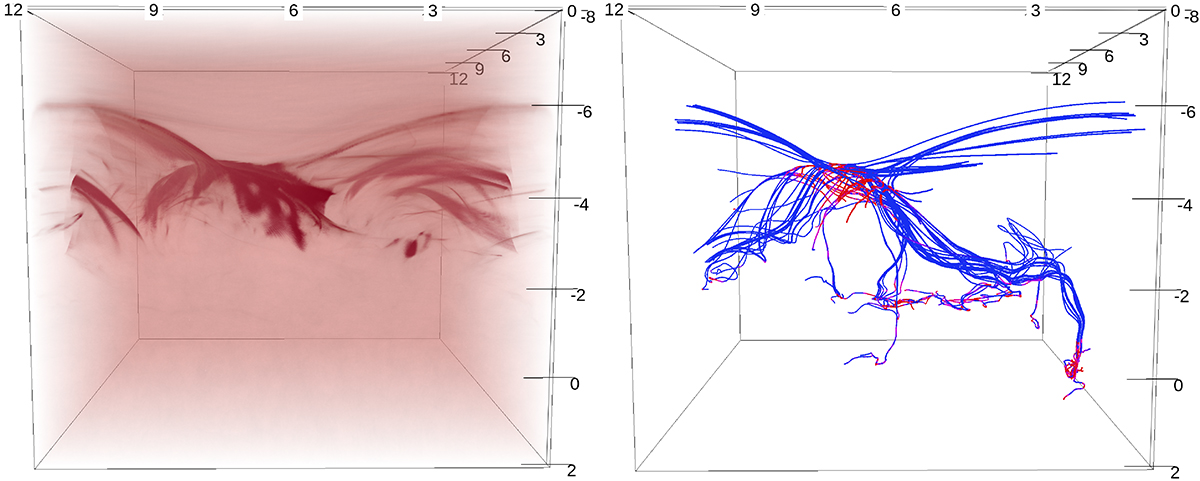
Fig. 3.
Download original image
Volume rendering of Joule heating at t = 11 360 s (left). Magnetic field tracing at t = 11 360 s with a strong positive bias towards ȷ/B at coronal heights above 3.5 Mm (right). The traced lines are colored by ȷ/B, red at highest values and blue at lowest values. There are high values of ȷ/B at the reconnection region and also deep in the convection zone (see flux concentration on the right side of the box) but the tracing is seeded only by coronal seeds with high ȷ/B values.
Current usage metrics show cumulative count of Article Views (full-text article views including HTML views, PDF and ePub downloads, according to the available data) and Abstracts Views on Vision4Press platform.
Data correspond to usage on the plateform after 2015. The current usage metrics is available 48-96 hours after online publication and is updated daily on week days.
Initial download of the metrics may take a while.