Fig. 8
Download original image
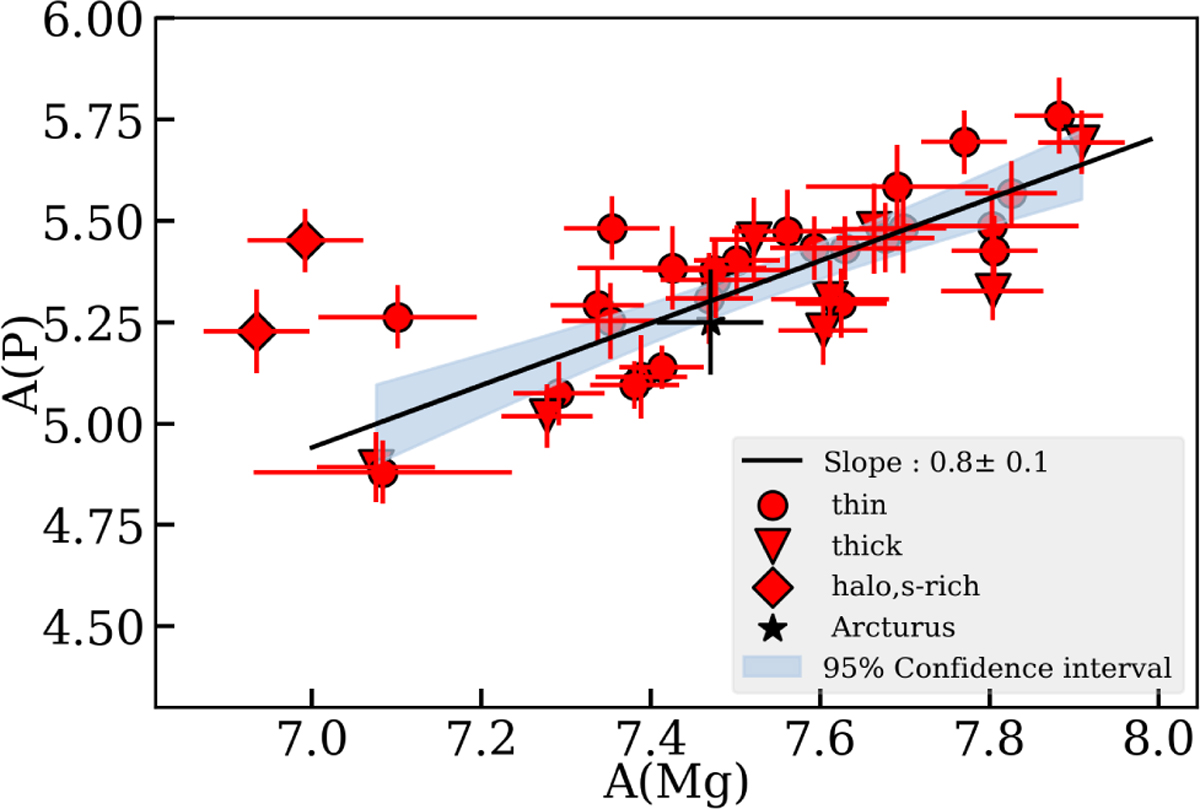
Abundance of phosphorus, A(P), vs. the abundance of magnesium, A(Mg), for stars in our sample. Excluding the two s-rich stars from the sample, we estimate a slope of 0.8 ± 0.1 using linear regression, with the 95% confidence interval marked in blue. This points to a primary behavior of phosphorus similar to magnesium. We adopted solar abundance values of 5.36 and 7.53 for phosphorus and magnesium, respectively, from Grevesse et al. (2007).
Current usage metrics show cumulative count of Article Views (full-text article views including HTML views, PDF and ePub downloads, according to the available data) and Abstracts Views on Vision4Press platform.
Data correspond to usage on the plateform after 2015. The current usage metrics is available 48-96 hours after online publication and is updated daily on week days.
Initial download of the metrics may take a while.