Fig. 7
Download original image
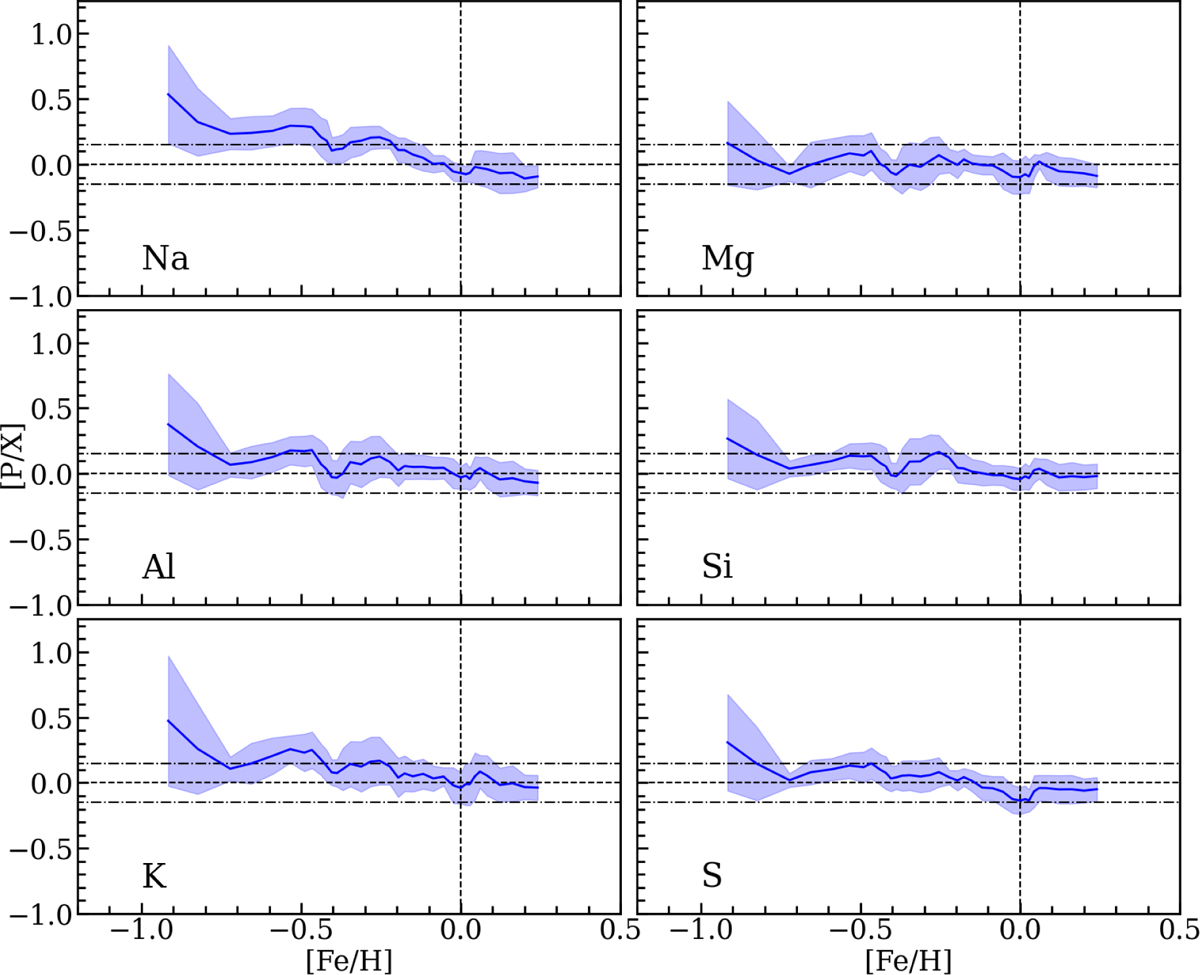
Running mean of the abundance ratios of phosphorus to odd-Z (Na, Al, and K in the left panels) and even-Z (Mg, Si, and S in the right panels) as a function of [Fe/H]. The running mean and standard deviation are shown with the blue line and blue band, respectively. The mean value, ([P/X]> (excluding the two s-rich stars), is denoted in the bottom right part of each panel. Horizontal dash-dotted lines represent [P/X] values of ±0.15 dex.
Current usage metrics show cumulative count of Article Views (full-text article views including HTML views, PDF and ePub downloads, according to the available data) and Abstracts Views on Vision4Press platform.
Data correspond to usage on the plateform after 2015. The current usage metrics is available 48-96 hours after online publication and is updated daily on week days.
Initial download of the metrics may take a while.