Fig. 6
Download original image
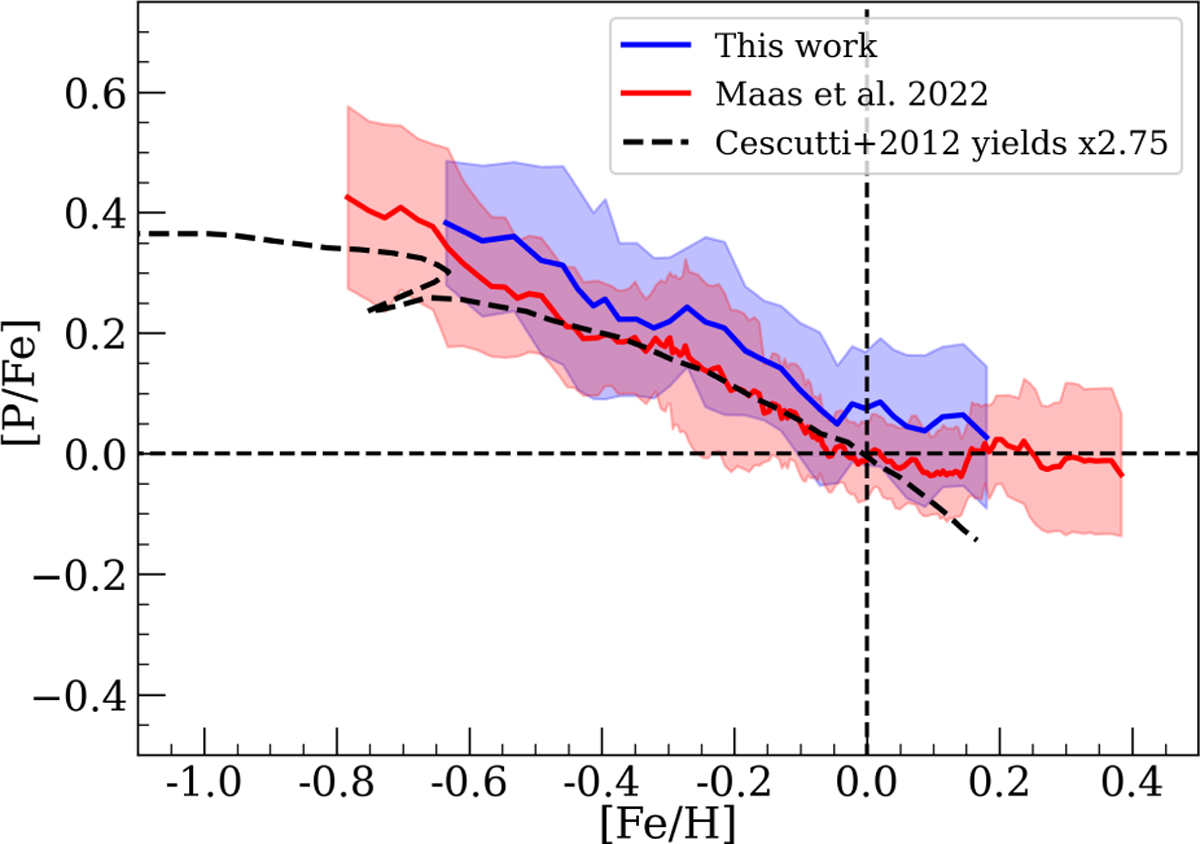
Running mean of [P/Fe] for the stars in our sample (blue line) and the Maas et al. (2022) sample (red line) as a function of [Fe/H]. The standard deviation is represented by the blue and red bands for our sample and the Maas et al. (2022) sample, respectively. With a dashed line, we show the chemical evolution trend in Cescutti et al. (2012).
Current usage metrics show cumulative count of Article Views (full-text article views including HTML views, PDF and ePub downloads, according to the available data) and Abstracts Views on Vision4Press platform.
Data correspond to usage on the plateform after 2015. The current usage metrics is available 48-96 hours after online publication and is updated daily on week days.
Initial download of the metrics may take a while.