Fig. 1
Download original image
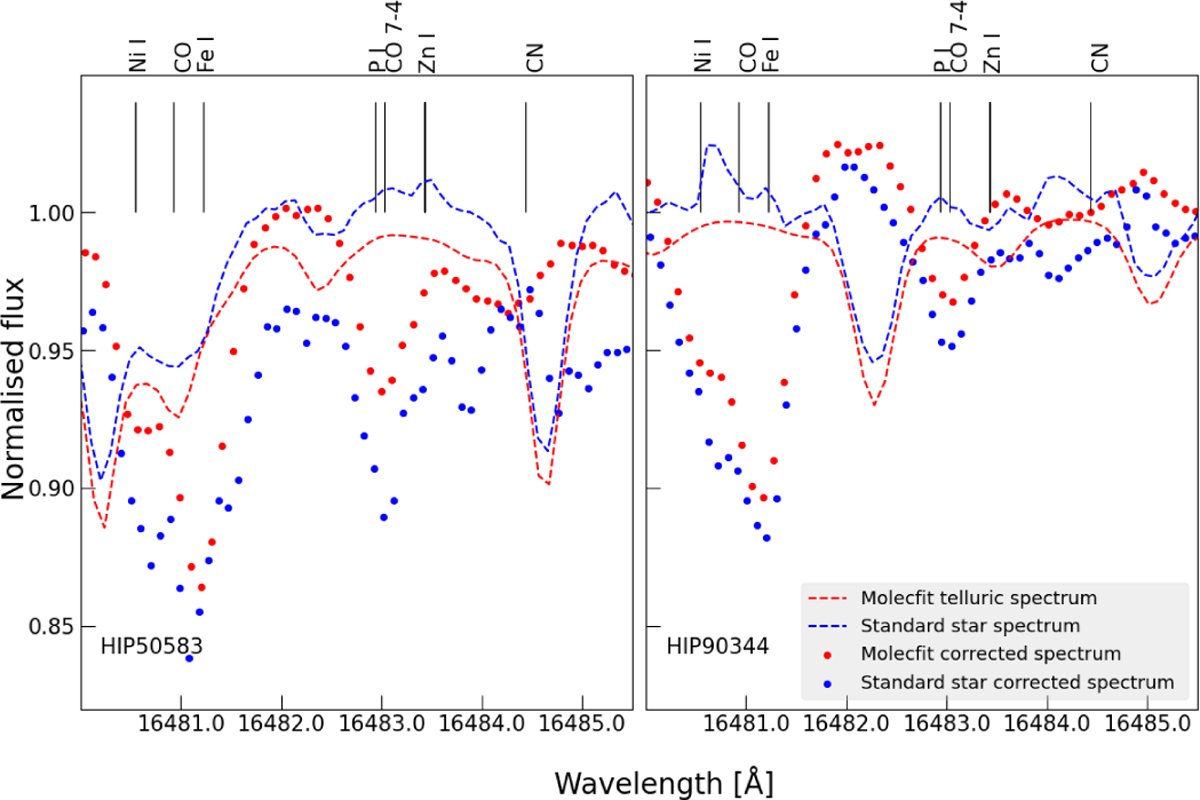
Molecflt-corrected spectrum (red dots) and the standard star-corrected spectrum (blue dots) around the P I line at 16482.92 Å for two stars in our sample. The normalized telluric spectra from the standard star observation and from using the Molecfit software tool are shown with a blue-dashed line and red-dashed line, respectively. Since the telluric standard star spectra show unexpected spurious features at the wavelengths of the phosphorus line, we eliminated the telluric lines with Molecfit. Using the standard star spectra with the spurious emission feature would lead to an artificial increase in the strength of the P I line.
Current usage metrics show cumulative count of Article Views (full-text article views including HTML views, PDF and ePub downloads, according to the available data) and Abstracts Views on Vision4Press platform.
Data correspond to usage on the plateform after 2015. The current usage metrics is available 48-96 hours after online publication and is updated daily on week days.
Initial download of the metrics may take a while.