Fig. 3.
Download original image
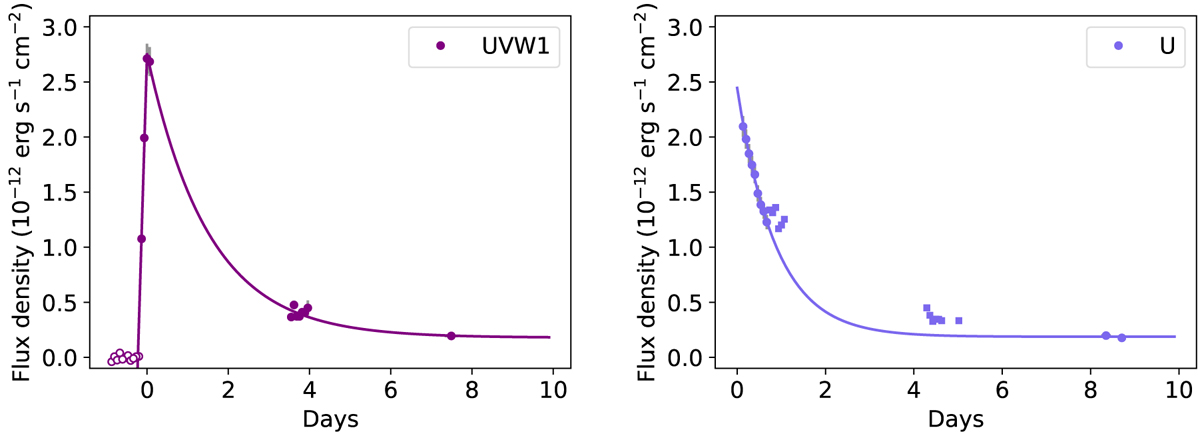
Fits to the UVW1 (left panel) and U (right panel) light curves. Detections are shown as solid circles and non-detections are shown as open circles. The rise in UVW1 is fit with a straight line using the first three detections. The decays for both U and UVW1 are fit with exponential functions. For U, the data shown with squares were not included in the fit (see Sect. 3.1 for details). For UVW1, all detections (starting from the peak) were used in the fit. The inferred t2 from the fit for UVW1 is 3.5 days, just before the cluster of data.
Current usage metrics show cumulative count of Article Views (full-text article views including HTML views, PDF and ePub downloads, according to the available data) and Abstracts Views on Vision4Press platform.
Data correspond to usage on the plateform after 2015. The current usage metrics is available 48-96 hours after online publication and is updated daily on week days.
Initial download of the metrics may take a while.