Fig. A.1.
Download original image
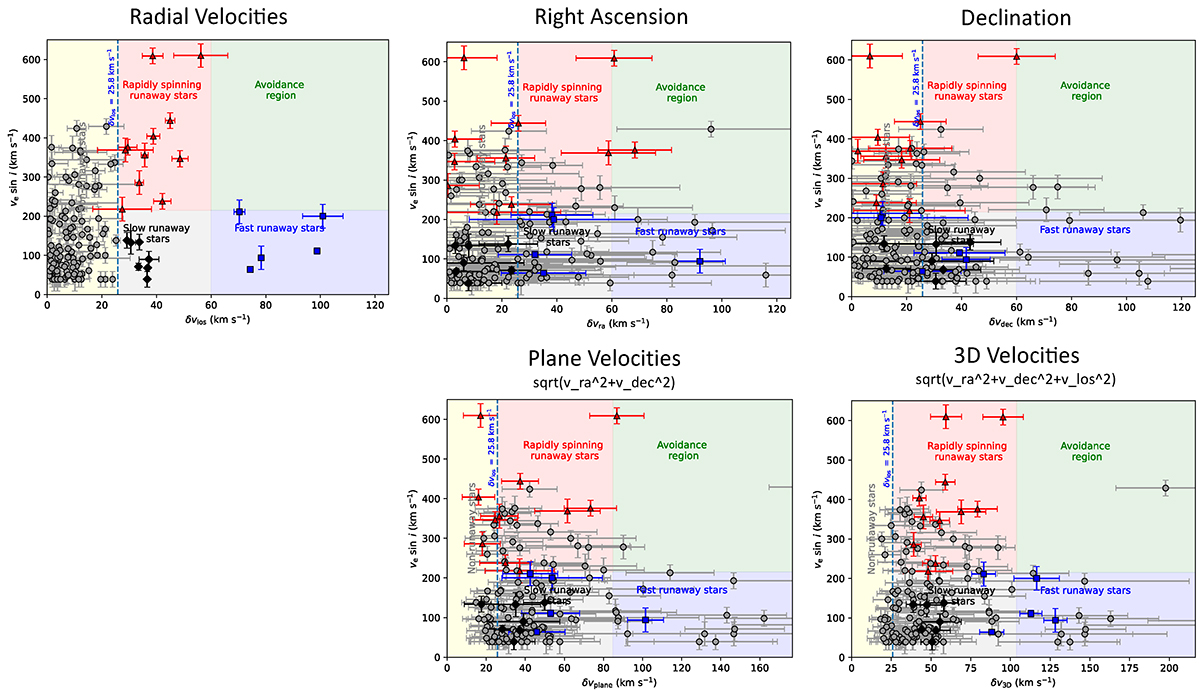
Diagram of the projected rotation velocities (ve sin i) versus peculiar 1D space velocities (along the line of sight, RA and DEC on the top row), as well as plane (2D) and 3D peculiar velocities (bottom row) for the full VFTS single O star sample. We exclude 32 objects with GAIA RUWE above 1.4, as this potentially indicate a poor fit or an unresolved system. The boundary of the RW desert obtained via line-of-sight velocities (ve sin i > 210 km s−1 and δvlos > 60 km s−1) have been corrected on the bottom row to account for the 2D and 3D nature of the observational constraints using scaling factors of ![]() and
and ![]() , respectively. The one object in the avoidance region in the 3D velocities panel displays δvdec ∼ 175 km s−1 and δvplane ∼ 200 km s−1, namely, values that are so large that they do not appear on the respective panels.
, respectively. The one object in the avoidance region in the 3D velocities panel displays δvdec ∼ 175 km s−1 and δvplane ∼ 200 km s−1, namely, values that are so large that they do not appear on the respective panels.
Current usage metrics show cumulative count of Article Views (full-text article views including HTML views, PDF and ePub downloads, according to the available data) and Abstracts Views on Vision4Press platform.
Data correspond to usage on the plateform after 2015. The current usage metrics is available 48-96 hours after online publication and is updated daily on week days.
Initial download of the metrics may take a while.