Fig. 6.
Download original image
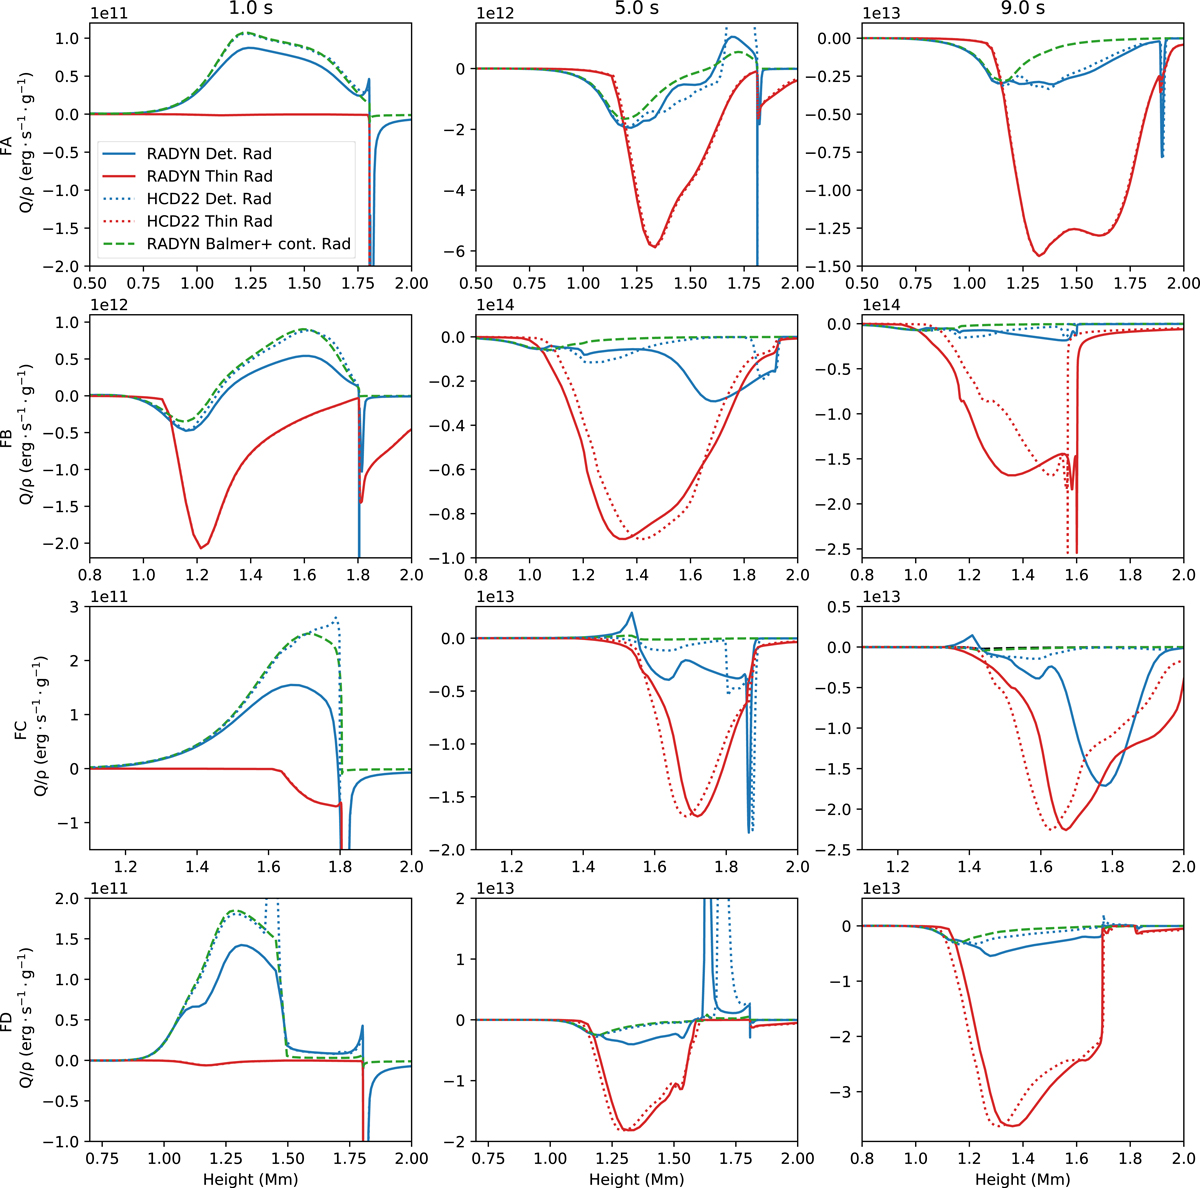
Height distributions of the radiative losses per unit mass (Q/ρ) calculated with detailed treatment of the radiative processes by RADYN (solid lines) and by the recipe of HCD22 (dotted lines). From top to bottom, the four rows represent the results for Cases FA, FB, FC, and FD. The blue and red lines represent the losses calculated with detailed treatment and with optically thin assumption in each panel, respectively. Also plotted are the radiative losses from H Balmer and higher continua (green dashed lines). A positive value means radiative heating, while a negative one means radiative cooling.
Current usage metrics show cumulative count of Article Views (full-text article views including HTML views, PDF and ePub downloads, according to the available data) and Abstracts Views on Vision4Press platform.
Data correspond to usage on the plateform after 2015. The current usage metrics is available 48-96 hours after online publication and is updated daily on week days.
Initial download of the metrics may take a while.