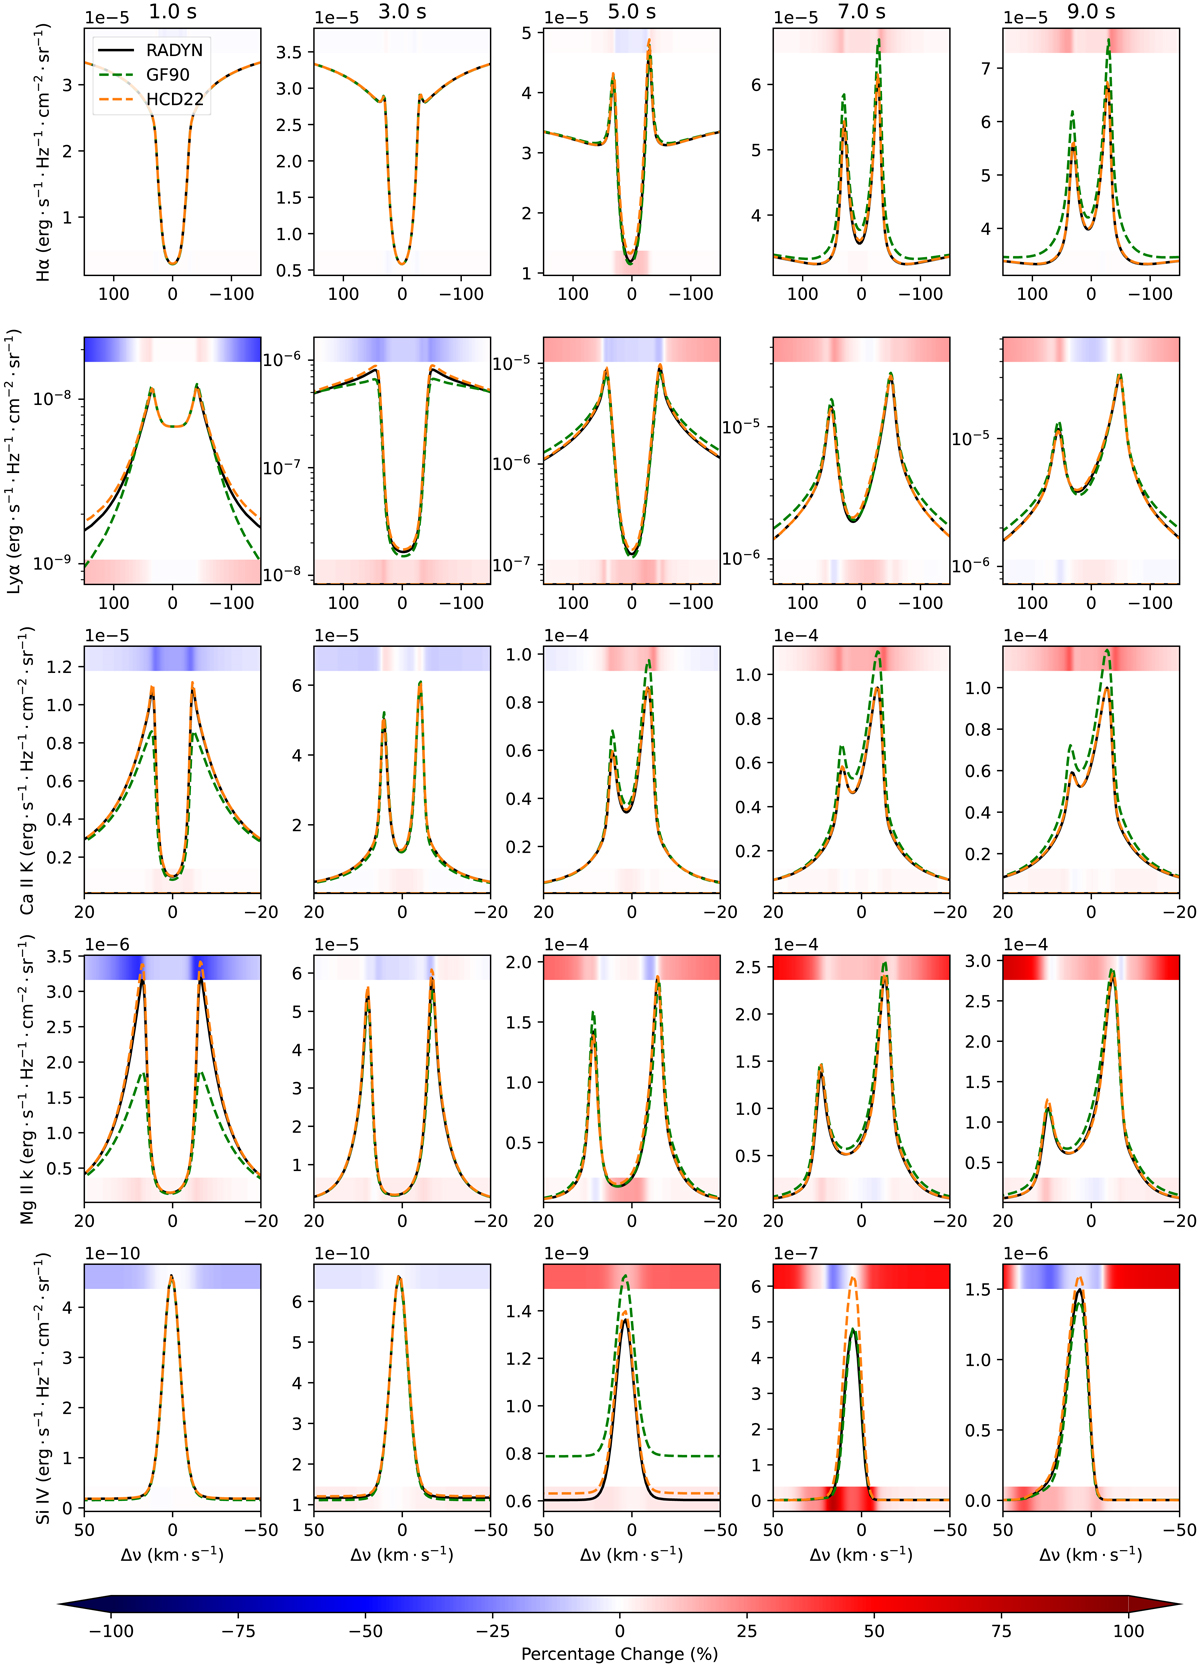
Fig. 4.
Download original image
Time evolution of the synthetic Hα, Lyα, Ca II K, Mg II k, and Si IV line profiles for FA. The horizontal axes are in the Doppler scale. The deviation between the GF90 and RADYN solutions is also shown as a horizontal bar in the top part of each panel, while that between the HCD22 and RADYN solutions is shown in the bottom part of each panel.
Current usage metrics show cumulative count of Article Views (full-text article views including HTML views, PDF and ePub downloads, according to the available data) and Abstracts Views on Vision4Press platform.
Data correspond to usage on the plateform after 2015. The current usage metrics is available 48-96 hours after online publication and is updated daily on week days.
Initial download of the metrics may take a while.